|
Getting your Trinity Audio player ready...
|
By Andrew Macken
What is Montaka’s goal? It’s to deliver our investors sustainable, excess returns over the long term.
Regular readers will be aware that we seek to achieve that through a concentrated portfolio of stocks. This is because research has shown that one of the prerequisites for long-term success is a highly concentrated portfolio[1].
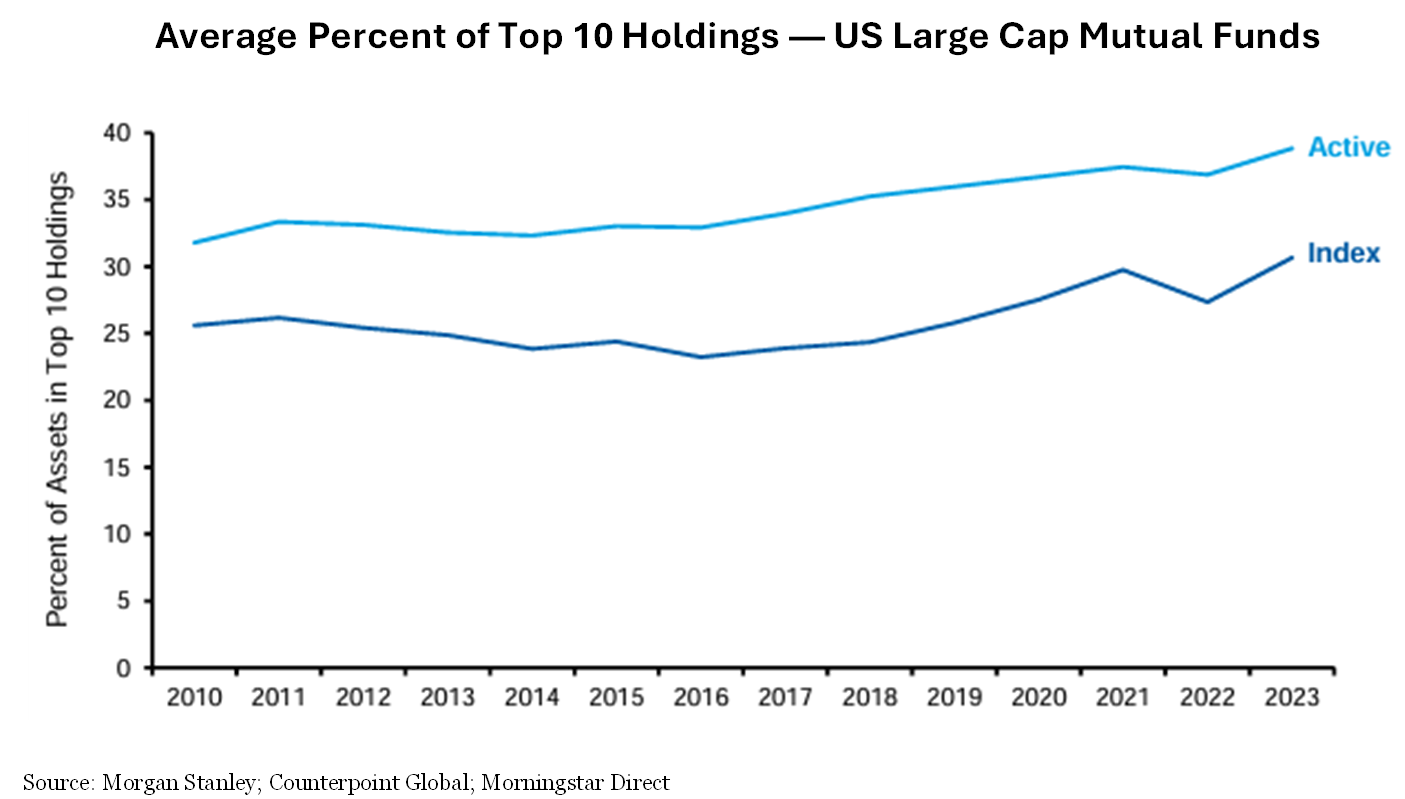
Montaka’s 10 holdings account for 75% of the total portfolio[2] By contrast, the top 10 holdings of US large-cap, actively managed mutual funds typically account for approximately 40% on average. If we were to plot Montaka’s portfolio concentration below, it would literally be ‘off the chart’.
But we do more than just pick stocks in a concentrated portfolio.
We also carefully engineer the overall construction of our portfolio. Our approach is informed by three foundational ideas:
- That ‘Compounders’ should dominate the portfolio, enhanced with a limited proportion of ‘Outliers’.
- That each opportunity should compete for capital on its own ‘return-per-risk’ merits.
- That portfolio aggregations should fall within our risk controls.
It is these 3 big ideas – when combined with our stock picking skills – that allow Montaka to build a concentrated portfolio of outstanding companies, to manage downside risk, and to maximize the probability of delivering our shareholders superior excess returns over the long term.
In this essay, we look at each of the three big ideas in turn.
Idea #1 — Compounders vs Outliers: not all investment types are created equal
Right up front, we classify every investment opportunity based on its stage of maturity and corresponding risk profile. The two most important categories we consider are Outliers and Compounders.
Outliers are earlier-stage businesses that have high potential but are yet to achieve large-scale adoption. They are just starting their move up the ‘S-curve’ but success is far from certain. The overwhelming likelihood for typical Outlier opportunities is significant downside. Yet when successful, Outlier opportunities have very large payoffs.
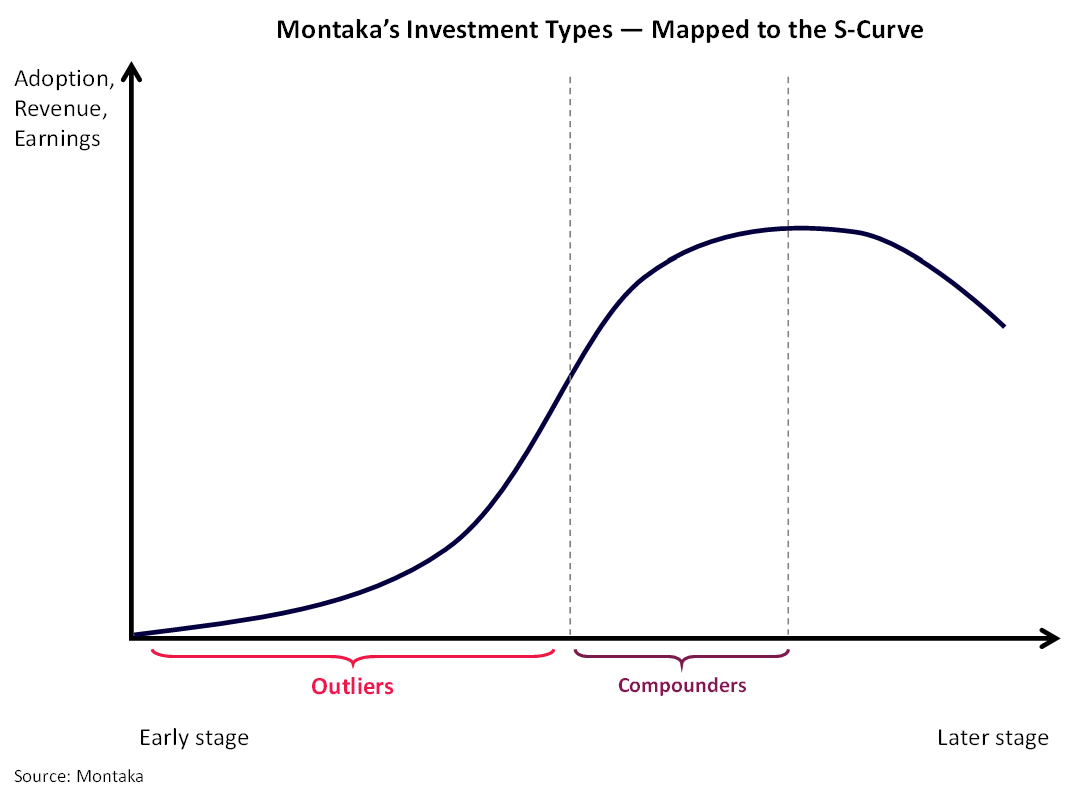
Compounders are later-stage businesses that have already moved up the steep part of the S-curve and have achieved substantial scale, incumbency, and competitive advantage. Relative to an Outlier, their future earnings trajectories are more certain.
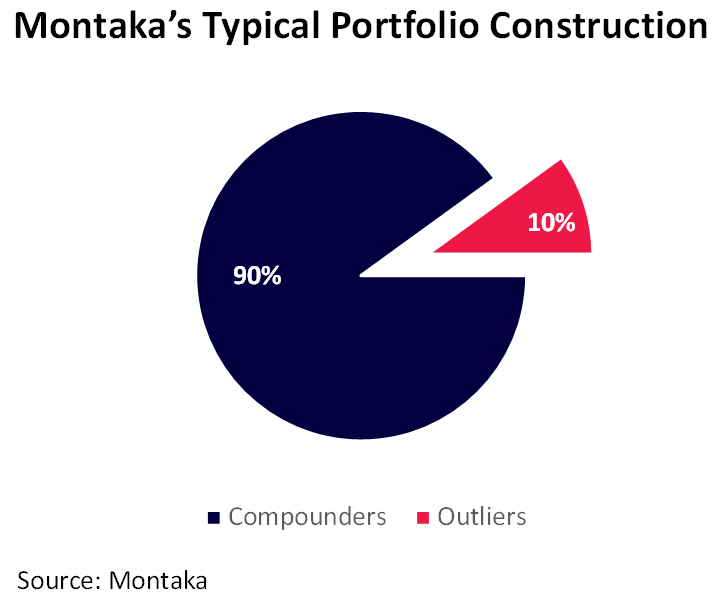
Montaka’s portfolio construction is deliberately dominated by Compounders. They typically account for approximately 90% of total exposure; Outliers approximately 10%.
We believe that Compounders offer the best combination of three things: very large potential payoffs; less downside potential[3]; and a higher tendency to be substantially mispriced by equity markets from time-to-time.
And yet, we still periodically choose to allocate a limited sleeve of capital to Outliers when we believe the market has mispriced a company’s probability of success. Given their extreme payoffs when successful, a small allocation to Outliers can add to Montaka’s long-term compounding without materially undermining its risk profile.
Idea #2 — Opportunities compete for capital based on comparable reward-per-risk
Have you ever wondered why Microsoft is 11% of Montaka’s portfolio, while S&P Global is less than 3%?[4]
It’s because specific position sizes reflect return-per-risk that we assess for each opportunity at any point in time.
Let’s unpack that.
For each investment opportunity, we rely heavily on our internally-generated assessments of company valuation outcomes under three scenarios: Bull Case, Base Case and Bear Case.
To determine valuations under each scenario, we build detailed forecasts of a company’s revenues, profit margins, capital investments, and cash flows of each business. We then tether these forecasts to our ‘Outside View’ analysis that considers the sizes, trajectories and opportunities within relevant external markets.
The hard work is worthwhile. For every portfolio opportunity (and others we are actively considering), our internal valuation analysis gives us consistent valuation scenarios with associated probability estimates.
From this data, we can stack rank each opportunity against the others based on two factors:
- The expected (probability-weighted) investment upside.
- The capital that would be at risk of permanent impairment (i.e., if our Bear Case scenario played out).
We then simply allocate more capital to investment opportunities that have greater expected upside and less risk of permanent capital impairment.
Today, for example, we see Microsoft as having a rare combination of substantial expected upside, with very limited permanent capital impairment risk. This is why it is one of Montaka’s largest positions today!
Finally, as stock prices move, so too do all of the calculations described in this section.
Investment upside is, of course, a function of today’s stock price. As a stock price goes up, the expected return falls, all else equal, and vice versa.
So we can repeat this process any day we like, and also when there are significant stock price moves and/or updates to our internal valuation assessments.
Idea #3 — Top-down classifications and risk controls: our last line of defense
Another vital part of our portfolio construction philosophy is to classify Montaka’s holdings by underlying features, and to then ensure these features fall within our risk-control guidelines at the aggregate, portfolio level.
Though we have a very high concentration, we still want some diversification in Montaka’s portfolio.
We aggregate a range of features, including underlying currency exposures, geographic concentrations, and sector concentrations (shown below).
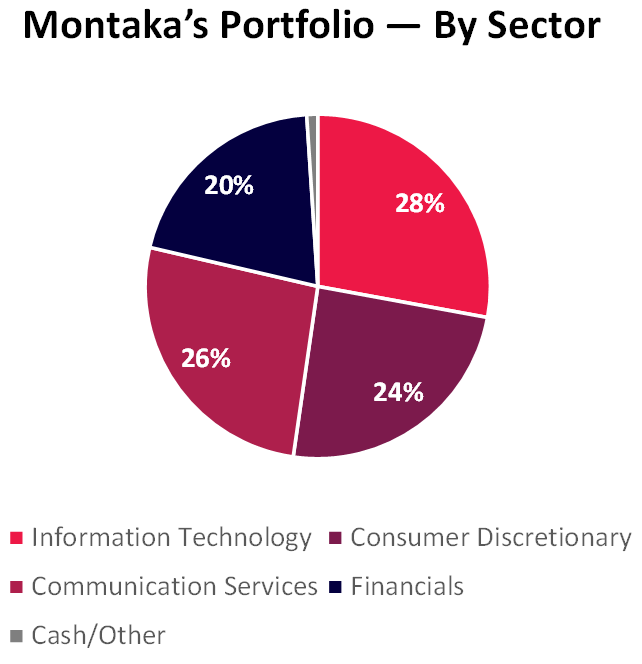
Note: Based on Montaka Global Fund (ASX: MOGL), 31 Oct 2025
Source: Montaka
For each aggregation, we ensure the total exposure conforms to our guidelines. In the case of sector exposures, for example, we limit any sector to a maximum of 30% of our total portfolio.
And we don’t stop there. We divide our portfolio based on other internal classifications that we believe are more meaningful than standard industry metrics.
Below is a chart with internal business classifications, complemented by our Compounder vs Outlier disaggregation.
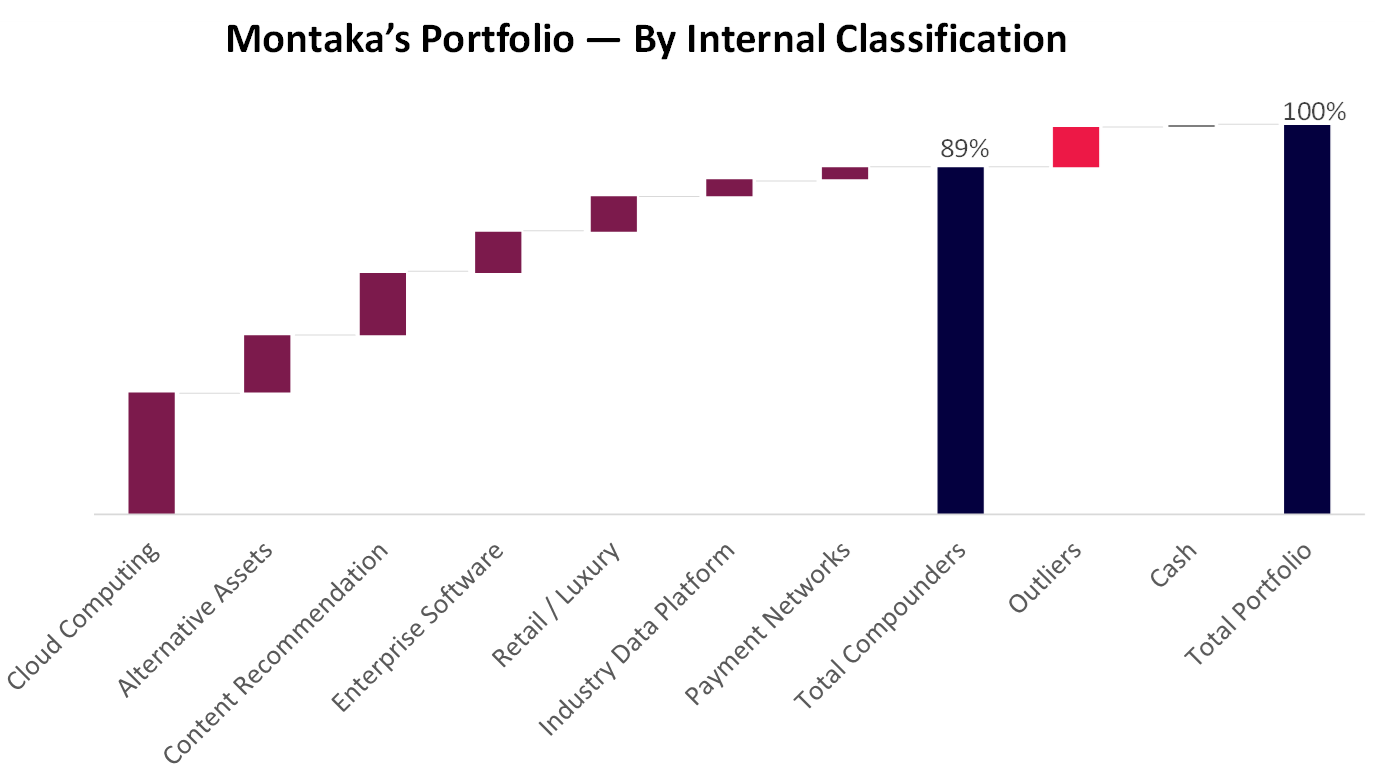
Note: Based on Montaka Global Fund (ASX: MOGL), 31 Oct 2025
Source: Montaka
The pursuit of long-term compounding
Montaka’s investment team does not just pick stocks.
We are also in the portfolio construction business. And the three big ideas above inform that construction.
When combined, these ideas allow us to carefully engineer Montaka’s portfolio, so it has the highly concentrated, yet diversified exposures needed to achieve sustainable excess returns while limiting risk.
This comprehensive, multi-layered approach to portfolio construction provides the necessary foundation for us to maintain our edge in the pursuit of long-term compounding for our investors.
Note:
[1] (Cremers) Active Share and the Three Pillars of Active Management: Skill, Conviction and Opportunity, 2016
[2] Based on Montaka Global Equities Fund (ASX: MOGL) as at 31 October 2025.
[3] Montaka views ‘downside potential’ through the lens of permanent capital impairment risk (not downside volatility).
[4] Position sizes based on Montaka Global Equities Fund (ASX: MOGL) as at 31 October 2025.
Andrew Macken is the Chief Investment Officer with Montaka Global Investments. To learn more about Montaka, please call +612 7202 0100 or leave us a line at montaka.com/contact-us
Podcast: Join the Montaka Global Investments team on Spotify as they chat about the market dynamics that shape their investing decisions in Spotlight Series Podcast. Follow along as we share real-time examples and investing tips that govern our stock picks. Click below to listen. Alternatively, click on this link: https://podcasters.spotify.com/pod/show/montaka
To request a copy of our whitepaper which explores the empirical research around the 3 pillars of active management outperformance, please share your details with us: