|
Getting your Trinity Audio player ready...
|
As we delve deeper into the cycle it is worth considering businesses that are less reliant upon a strong economic backdrop and don’t need buoyant conditions to thrive. Such companies are sometimes referred to as ‘defensive’ names. However, as we have explored several times on this blog in the past, traditional ‘defensive’ names can contain value-traps like consumer staples (e.g. Kraft-Heinz, etc) which are obviously best to avoid or even short. That said, there are businesses that are genuinely ‘defensive’ and today we will consider waste management- the faceless segment of society which will endure as long as man roams the Earth.
While every country has the need for waste management services and industries within exhibit similar characteristics, we will focus on the U.S. market today. The non-hazardous waste market in the U.S. is a mature industry which generates ~$60bn in revenue annually (i.e. Total Addressable Market or TAM). Publicly traded companies account for ~45% of total revenues, private companies ~35% and municipal / local government authorities represent the remaining ~20%.
Waste Management Industry Structure
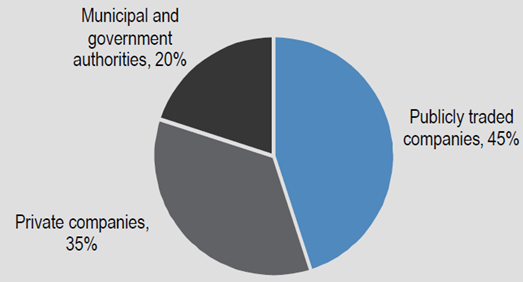
Source: JP Morgan
While there are numerous types of waste that society and humanity produces, we will be addressing solid waste today (red box below) and will leave special and hazardous waste for another day. The definition of these products and how they are generated are shown below.
Major Waste Generators and Types of Wastes
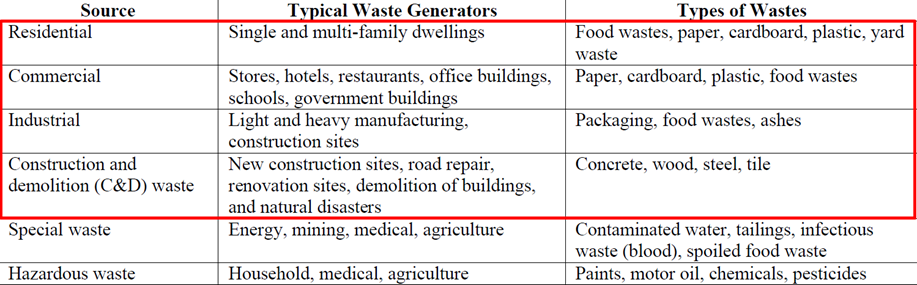
Source: World Bank, EPA
The main types of services offered by waste companies are collection, transfer, landfill, and recycling, with collection services representing the bulk of revenue with high level summary shown in the below table (more on this later).
Main Services Provided by Waste Companies:
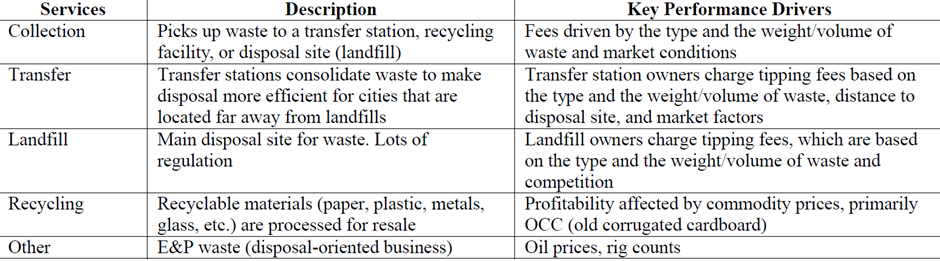
Source: World Bank, EPA
As far as the waste sector’s ‘defensive’ credentials go, it can be summed up as being less volatile than the overall market due to the nature of the essential service that it provides (collecting rubbish and disposing it off). The business model is anchored by multiyear contracts with recurring volumes and regular price increases, with residential customers representing a particularly sticky base. Looking back at the Global Financial Crisis (GFC) following 2008/2009, despite volume growth turning negative, pricing remained positive.
Waste disposal has evolved over time, with waste deposited at landfills peaking in 1990 on a volume basis and more and more waste being recycled, composted, or combusted (i.e. burned). Still, landfill accounts for the majority of waste disposal at >50% in 2015, according to the EPA.
Waste Disposal as % of Waste Generated
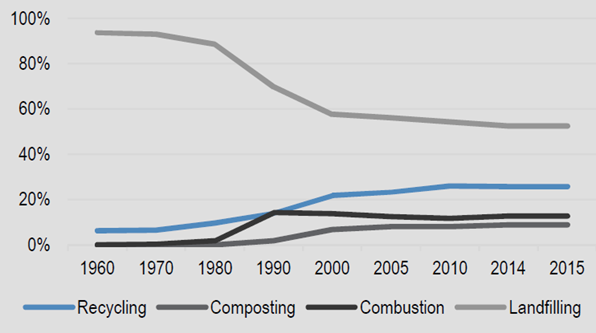
Source: Environmental Protection Agency (EPA)
The North American waste industry is highly competitive, with three large national corporations and many regional and local players. These companies compete with government entities like municipalities, many of which have government allocated budgets and financial advantages such as tax-exempt financing. Of the investible universe, the three major, listed waste management companies in the U.S. consist of Waste Management (WM: $50bn market capitalization) which is the largest non-hazardous solid waste company in North America, with nearly 20 million customers. Republic Services (RSG: $28bn) is the second largest following its 2008 merger with Allied Waste Industries. Finally Waste Connections (WCN: $23bn) became the third largest after it merged with Progressive Waste Solutions on June 1, 2016, it also has a substantial Canadian business which represents ~15% of total company revenue.
Of the services provided by waste management companies, ‘Collection’ represents the bulk of revenues which involves the picking up of trash and the transportation to a transfer station, recycling facility, or disposal site (landfill). ‘Landfill’ remains the main disposal sites for waste and is heavily regulated (federal, state, and local levels) hence it is difficult to build new landfills in North America which provides a significant barrier to entry for companies that own them. Another major advantage of owning a landfill is vertical integration and internalizing the significant margin that would otherwise be paid away to utilize a third-party landfill. By extension, landfill owners can charge ‘tipping fees’ to third-party waste haulers that do not have their own landfills, thereby generating additional revenue. Of the roughly 1,700 landfills in the U.S., WM, RSG, and WCN own ~30% of them, with WM owning and operating the largest network.
‘Transfer’ service is the third largest service (after collection and landfill that waste management companies provide. Transfer stations are intermediate locations between where waste is collected and where it is eventually disposed, with transfer station owners like WM, RSG, and WCN, charging third-party waste haulers fees to use their stations. While ‘Recycling’ remains a small part of revenues currently, it has increased in relevance as environmental concerns have risen and consumers are more aware and focused on sustainability. As a side note, the largest recycled waste material in the U.S. is Old Corrugated Cardboard (OCC), followed by plastic, metals, and glass.
Owning the whole supply chain from collection routes, to transfer stations, to landfills allows companies to achieve greater ‘internalization’ and higher margins. Internalization refers to the percentage of waste collected by a company that is deposited in its own landfill. As more landfills close and as collection markets (i.e. cities, urban populations, etc) are located farther away from disposal sites, controlling the point of transfer has also become important to company profitability. WM, RSG, and WCN are all vertically integrated players with high internalization rates of 66%, 68%, and 55%, respectively. As we look out into the cycle these companies may prove to be interesting opportunities, provided the team at Montaka Global can see value at the prevailing share prices.
Waste Companies Revenue Breakdown by Service
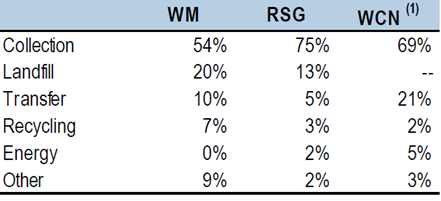
Notes: (1) Landfill + Transfer = 21%
Source: JP Morgan
 Amit Nath is a Senior Research Analyst with Montaka Global Investments. To learn more about Montaka, please call +612 7202 0100.