|
Getting your Trinity Audio player ready...
|
In this blog, we describe the framework for how we think about commodities and use it to explain why we believe the oil price will likely stay lower for longer. Montaka has a number of positions in the portfolio that will profit from such a scenario, on behalf of clients.
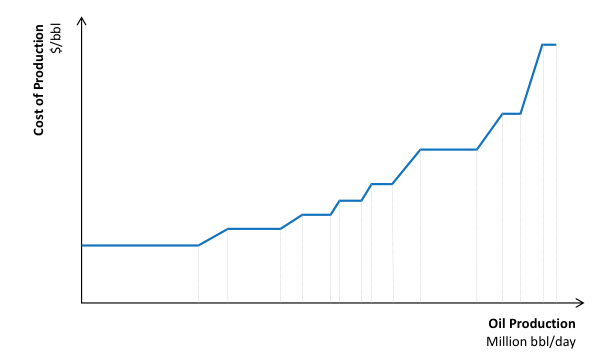
Now, imagine you compiled a list of each oil-producing region in the world with: (i) how much they were producing, measured in millions of barrels per day; and (ii) the operating cost to deliver said production, measured in dollars-per-barrel. Imagine you then created a rectangular box for each oil-producing region with its width reflecting production and its height the cost of its production. Stacking these boxes from left to right, smallest to tallest, will result in something like the following chart. This is essentially the “supply curve” of the oil industry, in economic speak.
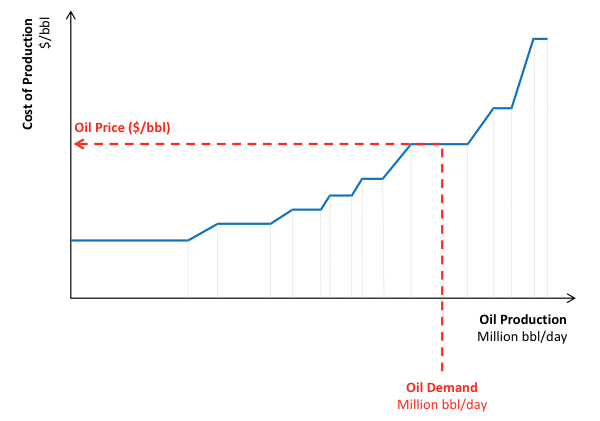
Now, imagine you walked along the horizontal axis (which reflects the volume of oil currently being produced) until you reached the point that was equal to the volume of oil that the world currently consumes (known as “demand” in economic speak). Well, at this point, the height of that box will essentially represent the global oil price. This is illustrated below.
In simple terms, think of the very low-cost producers (bottom-left boxes) as the Saudis and other OPEC nations; and think of the higher cost producers as North American oil projects. The chart below illustrates a far more detailed version of this framework, courtesy of Citi.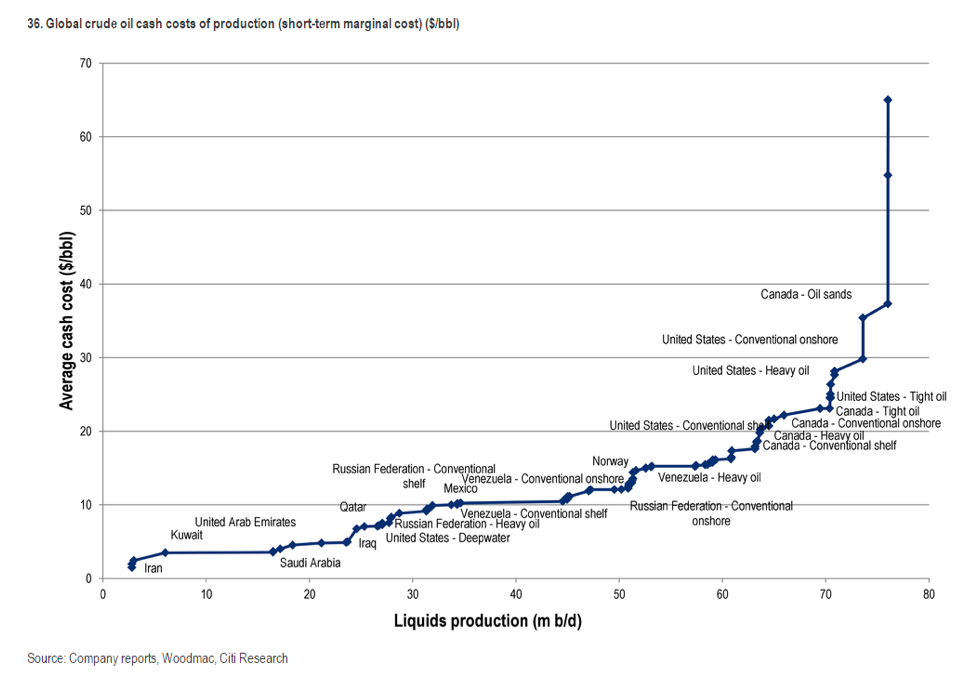 Now, what happens to the oil price if, for example, the Saudis accelerate the volume of oil they currently produce? (And, by-the-way, this is exactly what they have been doing). Well, our framework can tell us what will likely happen. Assume the bottom-left box on our chart is the Saudi production: now to expand its production, we extend its width to the right; and this shifts all the other boxes to the right as well. The new arrangement is our “new supply curve” that incorporates the expanded production from the Saudis.
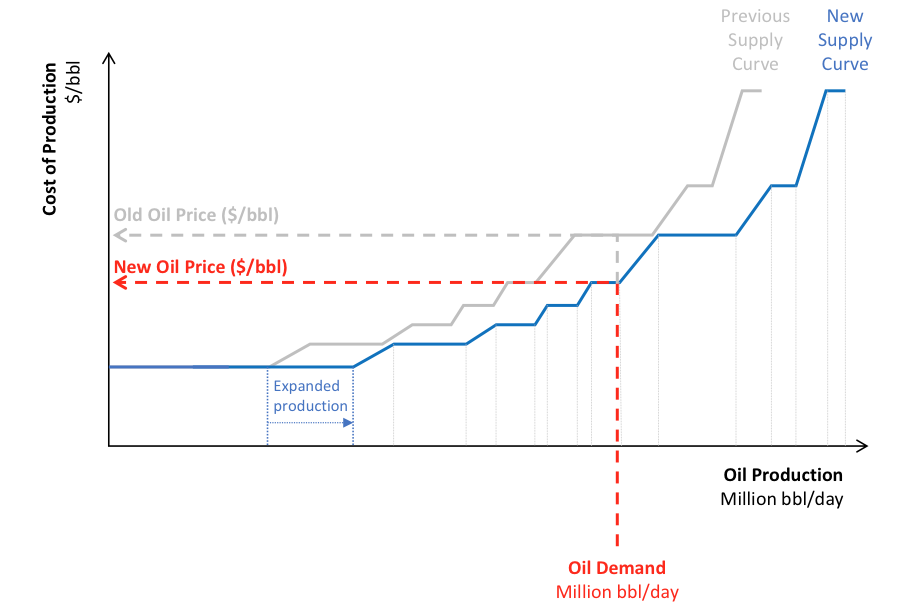 To evaluate the price, we do exactly the same as before. We overlay demand and determine at what height it intersects with the supply curve. This is the new global oil price level, as illustrated below. Note how the price has fallen! As low-cost producers increase production, the oil price should fall.
Simple enough, right? So surely this means that if the Saudis were to “cut” their production, the reverse should be true and the price should revert back to its original level. Well, not so fast…
You see, one of the underappreciated second-order effects of the Saudis expanding their oil production this year (and the resulting collapse in the oil price) has been the enormous cost-reduction efforts undertaken by the higher-cost producers, particularly in North America.
As illustrated by the Bernstein table below, cost reductions across the board have been significant and typically averaged savings of around 15-20% in 2015 alone. We expect such cost reductions to continue well into 2016, at a minimum.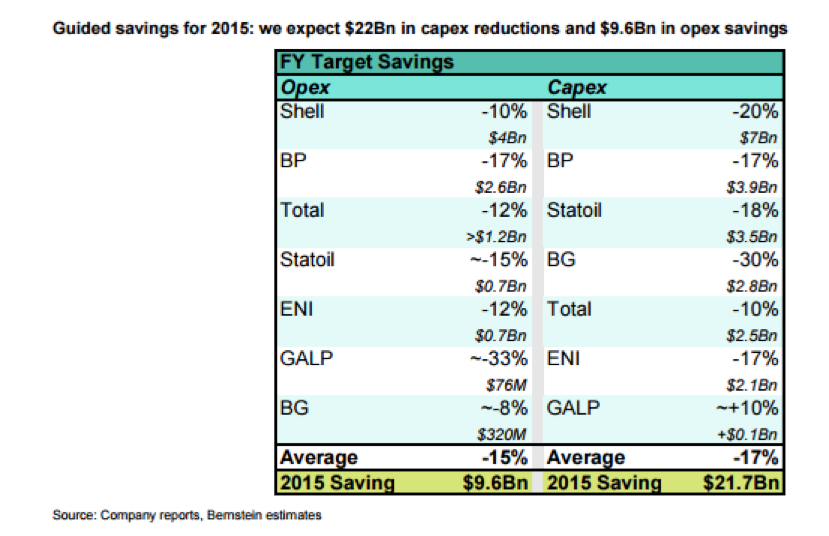 Such cost-reduction programs have the effect of “flattening” the global supply curve. To go back to our original framework, the height of the boxes have now reduced, as shown in the chart below. This means that if, for example, the Saudis cut their production back to original levels, the oil price would not return to its original starting point: it would remain lower!
 To summarize where we are today, we know the following basic facts:
- OPEC production accelerated to 3-year highs in 2015, led by strong production from Saudi Arabia. While the exact motivation is unclear, many believe the Saudis are trying to push much of the North American supply out of the market.
- The resulting low-oil prices have perversely created the incentive for other OPEC nations to also accelerate supply to maintain oil revenues that are needed to fund public budgets. This only exacerbates the oil price downturn.
- Low oil price expectations have motivated oil producers around the world to aggressively cut costs out of their operations. As illustrated above, this has flattened the global supply curve, meaning that prices will likely remain lower for longer, even if OPEC supply is rationalized back to original levels.
![]()
Andrew Macken is a Portfolio Manager with Montgomery Global Investment Management. To learn more about Montaka, please call +612 7202 0100.