|
Getting your Trinity Audio player ready...
|
One of the most common and straightforward passive investment strategies is to “buy-and-hold” an index of stocks. Proponents of this strategy typically believe that “time in the market, not timing the market”, produces the best returns. They may point to the attractive returns generated by equity markets over a (very) long time horizon, for example the 9.7% total annualised return of the S&P 500 since 1927, as evidence that this is somehow a foolproof method for building wealth. But is this true in practice?
The idea of buying and holding a broad market index over years or decades is appealing for most investors because i) it smooths out market cycles, ii) it removes the idiosyncratic risk of individual stocks, and iii) it can be set to autopilot. However, leaving aside all the behavioural biases that impede our ability to hold volatile investments over extended time horizons, this strategy tends to ignore the most fundamental relationship in investing – that between price and value. Regardless of whether we are investing in individual stocks or in a market index, the price we pay initially will ultimately determine our returns down the road.
Let’s take a look at the S&P 500 example. The index returned 9.7% annualised, including reinvested dividends, in the 90 years between 1927 and 2017, or 6.5% on an inflation-adjusted (real) basis. Immediately, we have a problem – no one realistically has a 90-year investment horizon. So what’s a reasonable horizon? Let’s consider a 10-year investment horizon first – long enough for most emotional investors to have flip-flopped in and out of their investments multiple times. The chart below shows the real 10-year annualised return for each of the 10-year periods starting from 1928 to 2007, plotted against the P/E ratio of the S&P 500 in the initial year of investment.
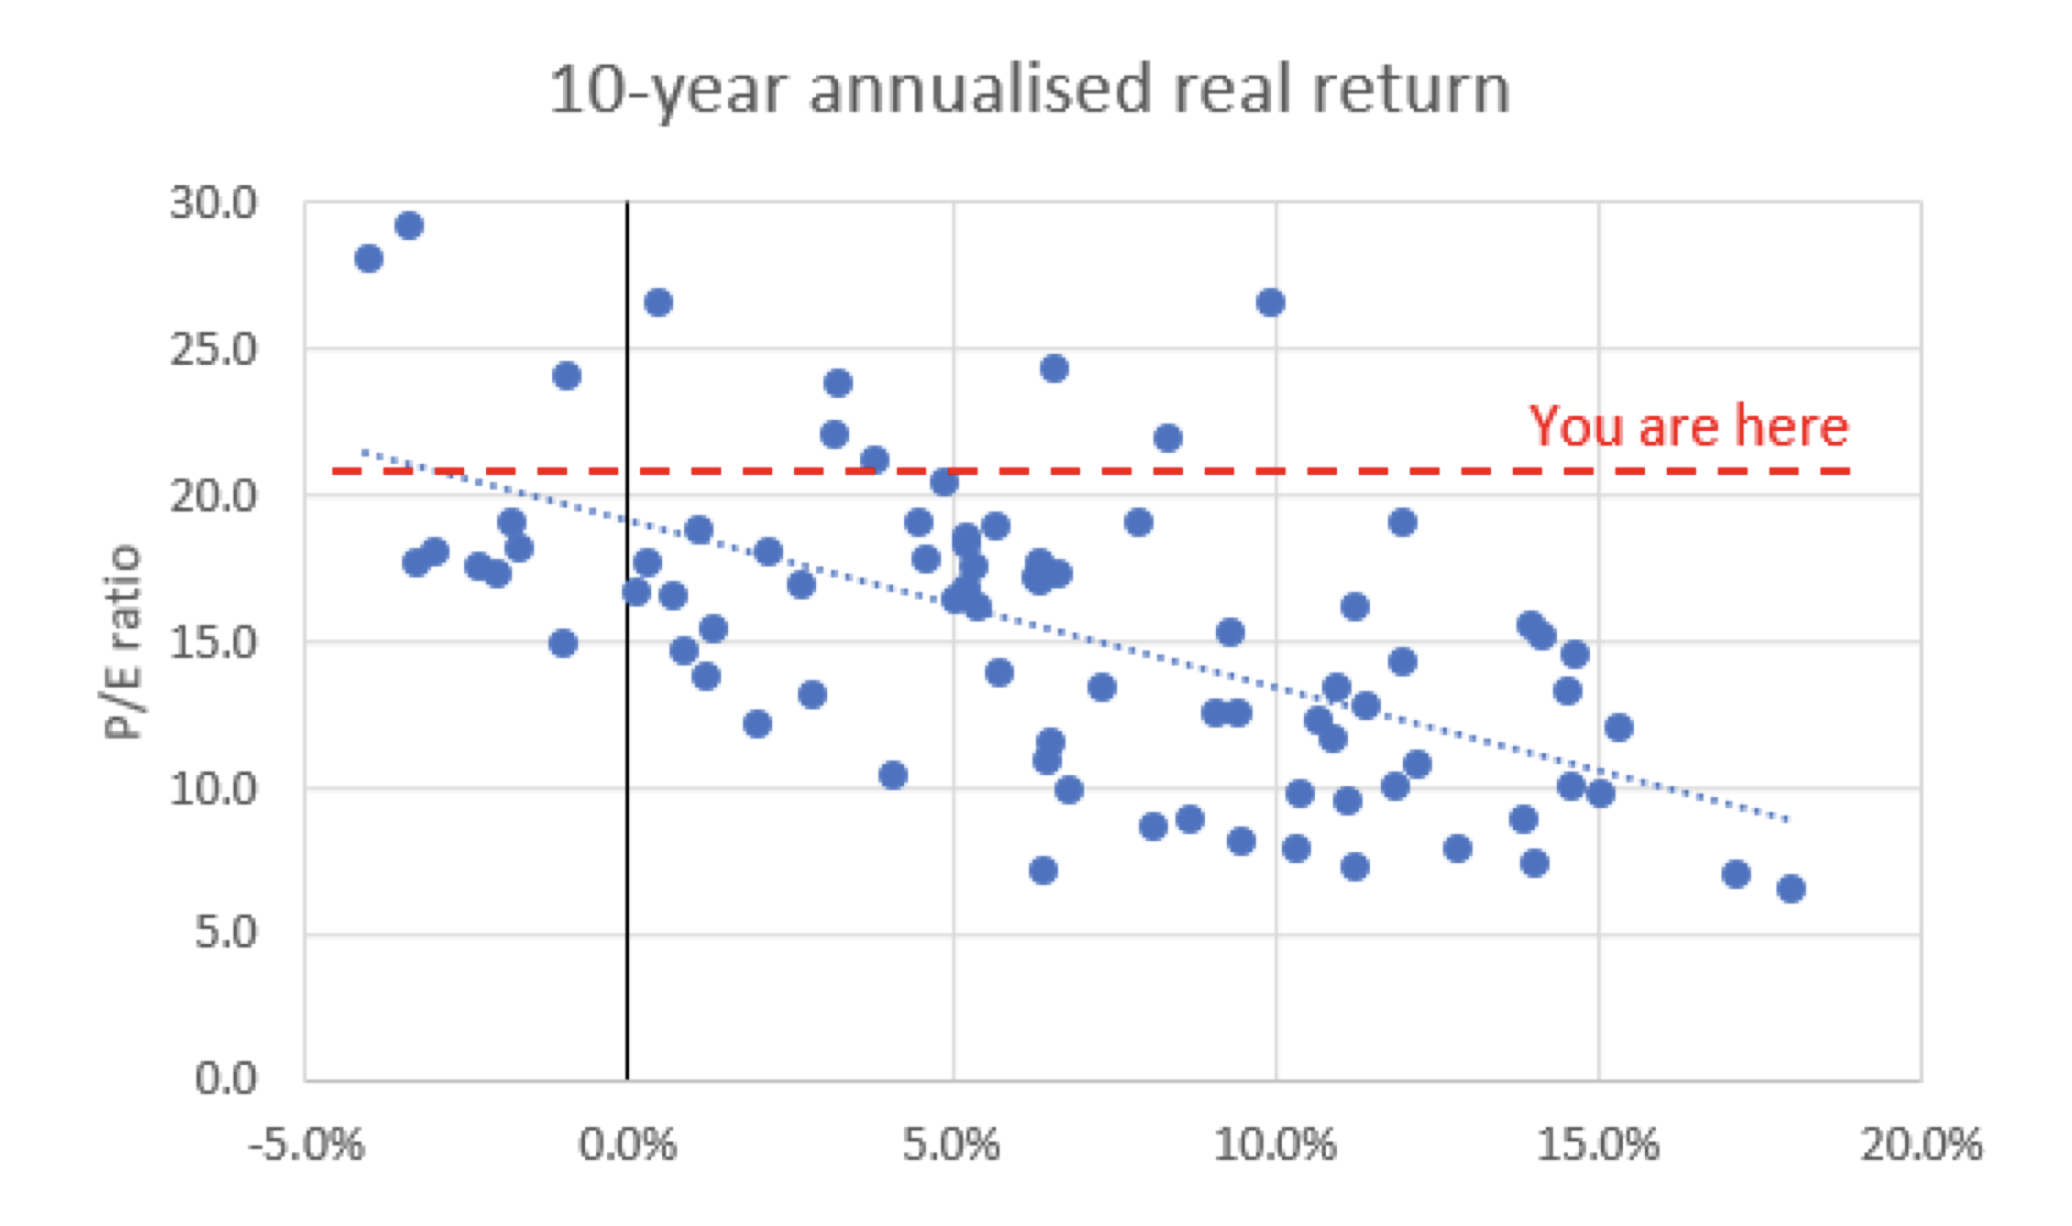
Source: Bloomberg, R. Shiller for P/E; A. Damodaran for S&P 500 total return
As can be seen, the price at which you buy the index has a significant influence on what your returns are in 10 years’ time. The average return of 10-year periods starting with a P/E greater than 20x (11 periods) is a measly 2.9%, while the average return of periods starting with a P/E less than 10x (13 periods) is 11.6% – a difference of 8.7% p.a.! And as the red line indicates, the S&P 500 is currently trading at a trailing P/E of 21x, so investors are more likely than not to see poor returns, or even negative returns, over the next 10 years.
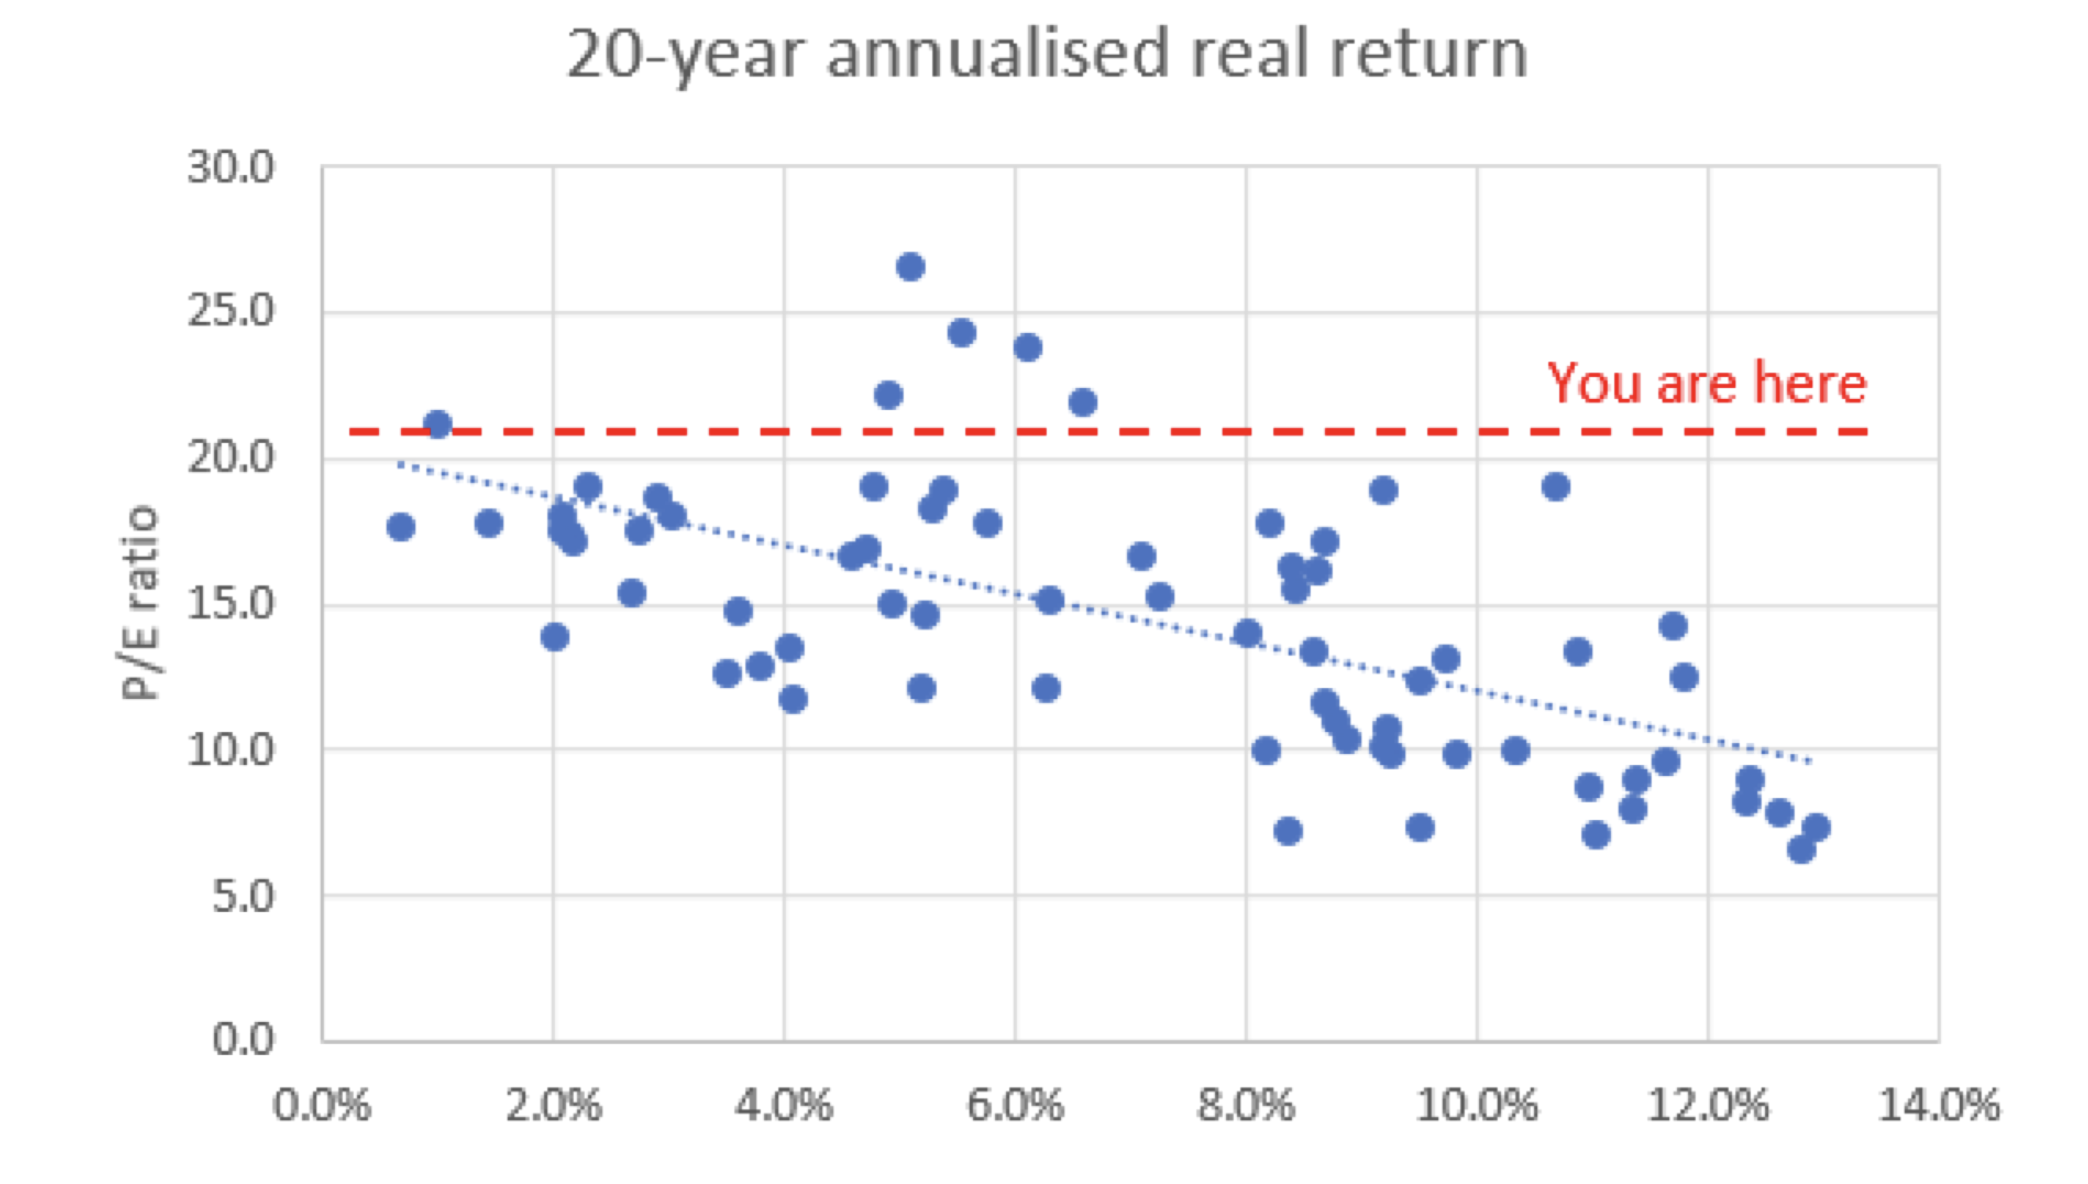
With a 20-year horizon, the chart below still looks similar to the 10-year chart, but with slightly higher mean and narrower standard deviation. A buy-and-hold investor with a 20-year horizon is still more likely than not to earn a poor future return if they bought the S&P 500 today.
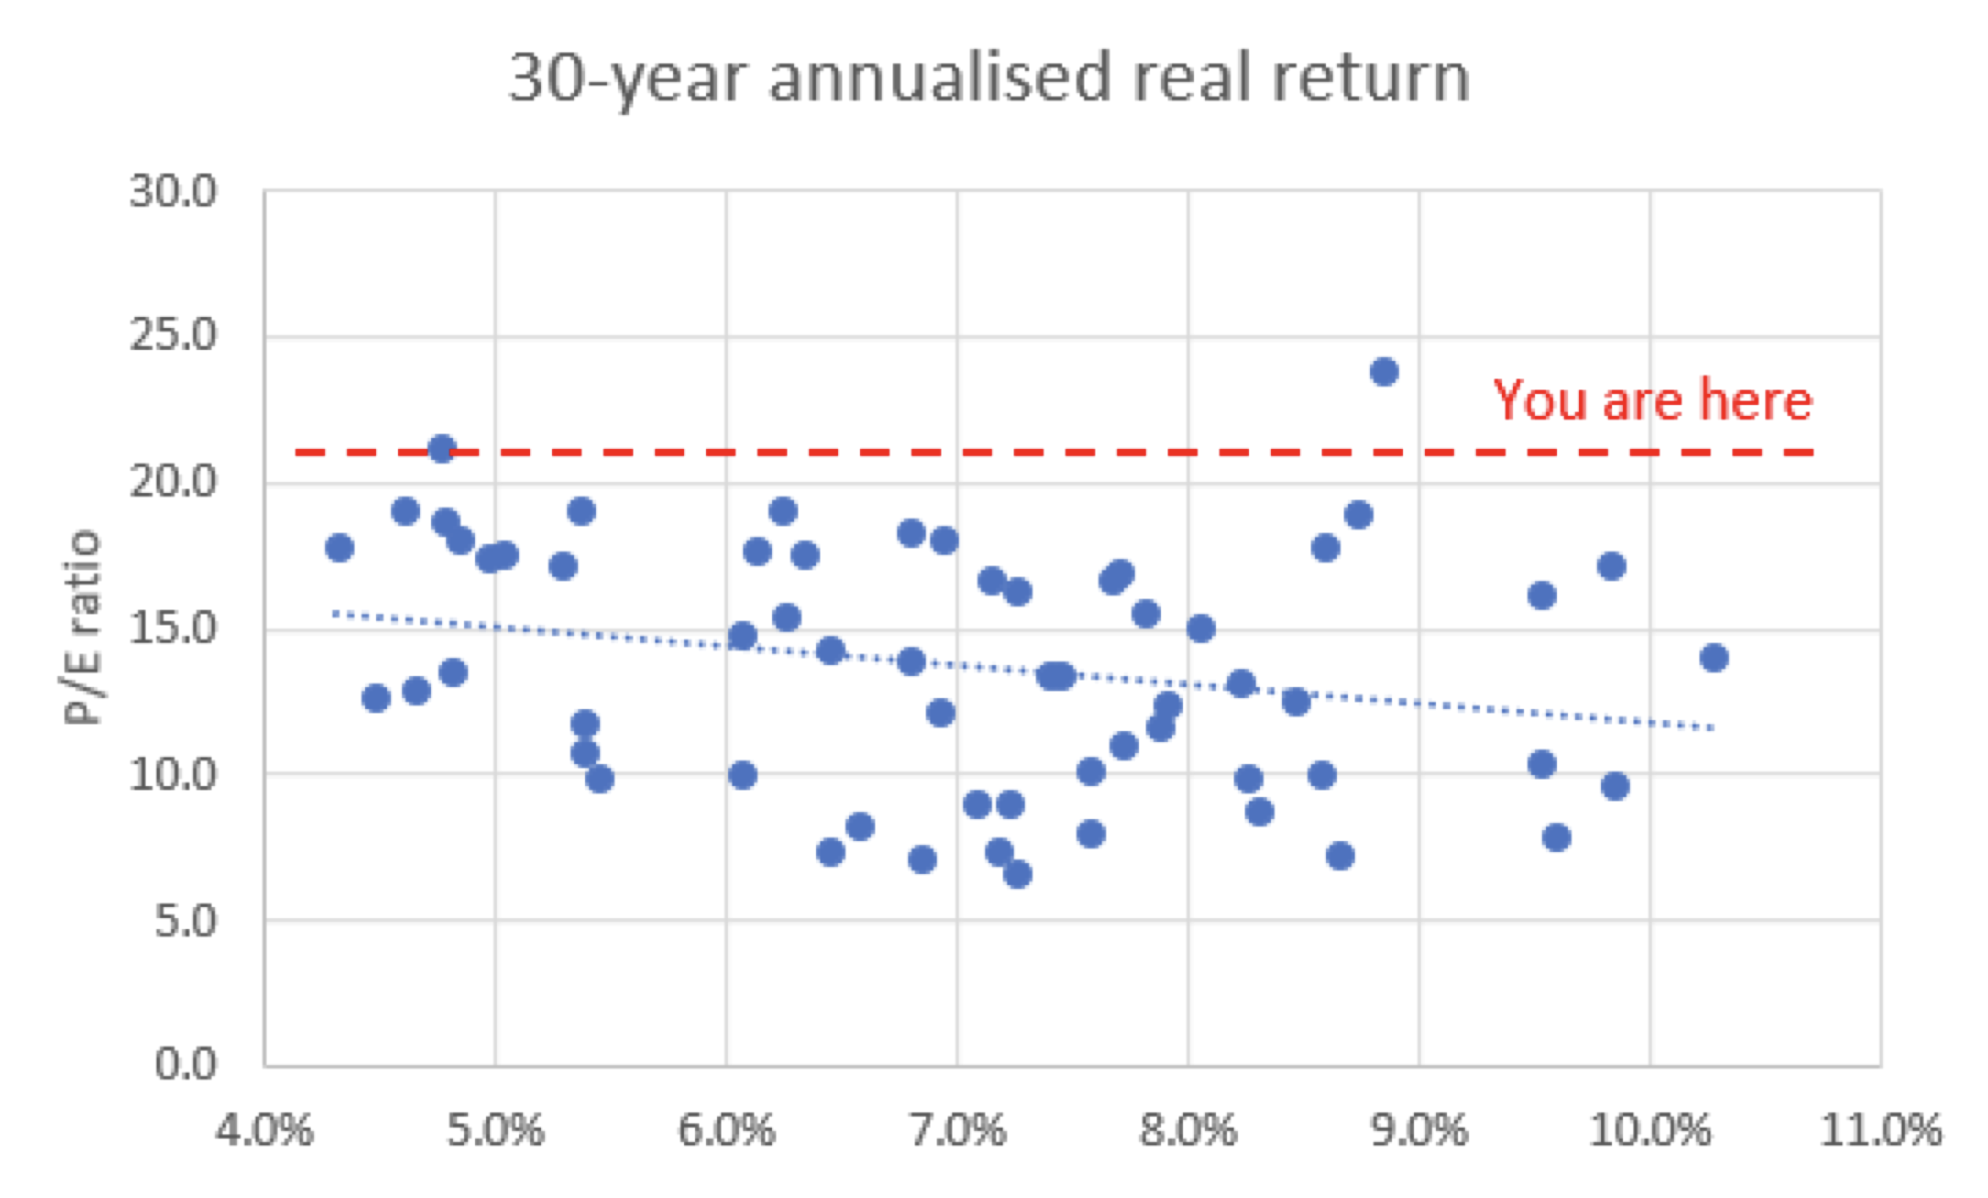
 Finally, at 30 years – the limit of reasonable horizons for someone in their 30’s looking to accumulate for retirement – the trendline has flattened but is still slightly negative. What this shows is that even over extremely long investment horizons, “time in the market” doesn’t quite make up for overpaying at the start.
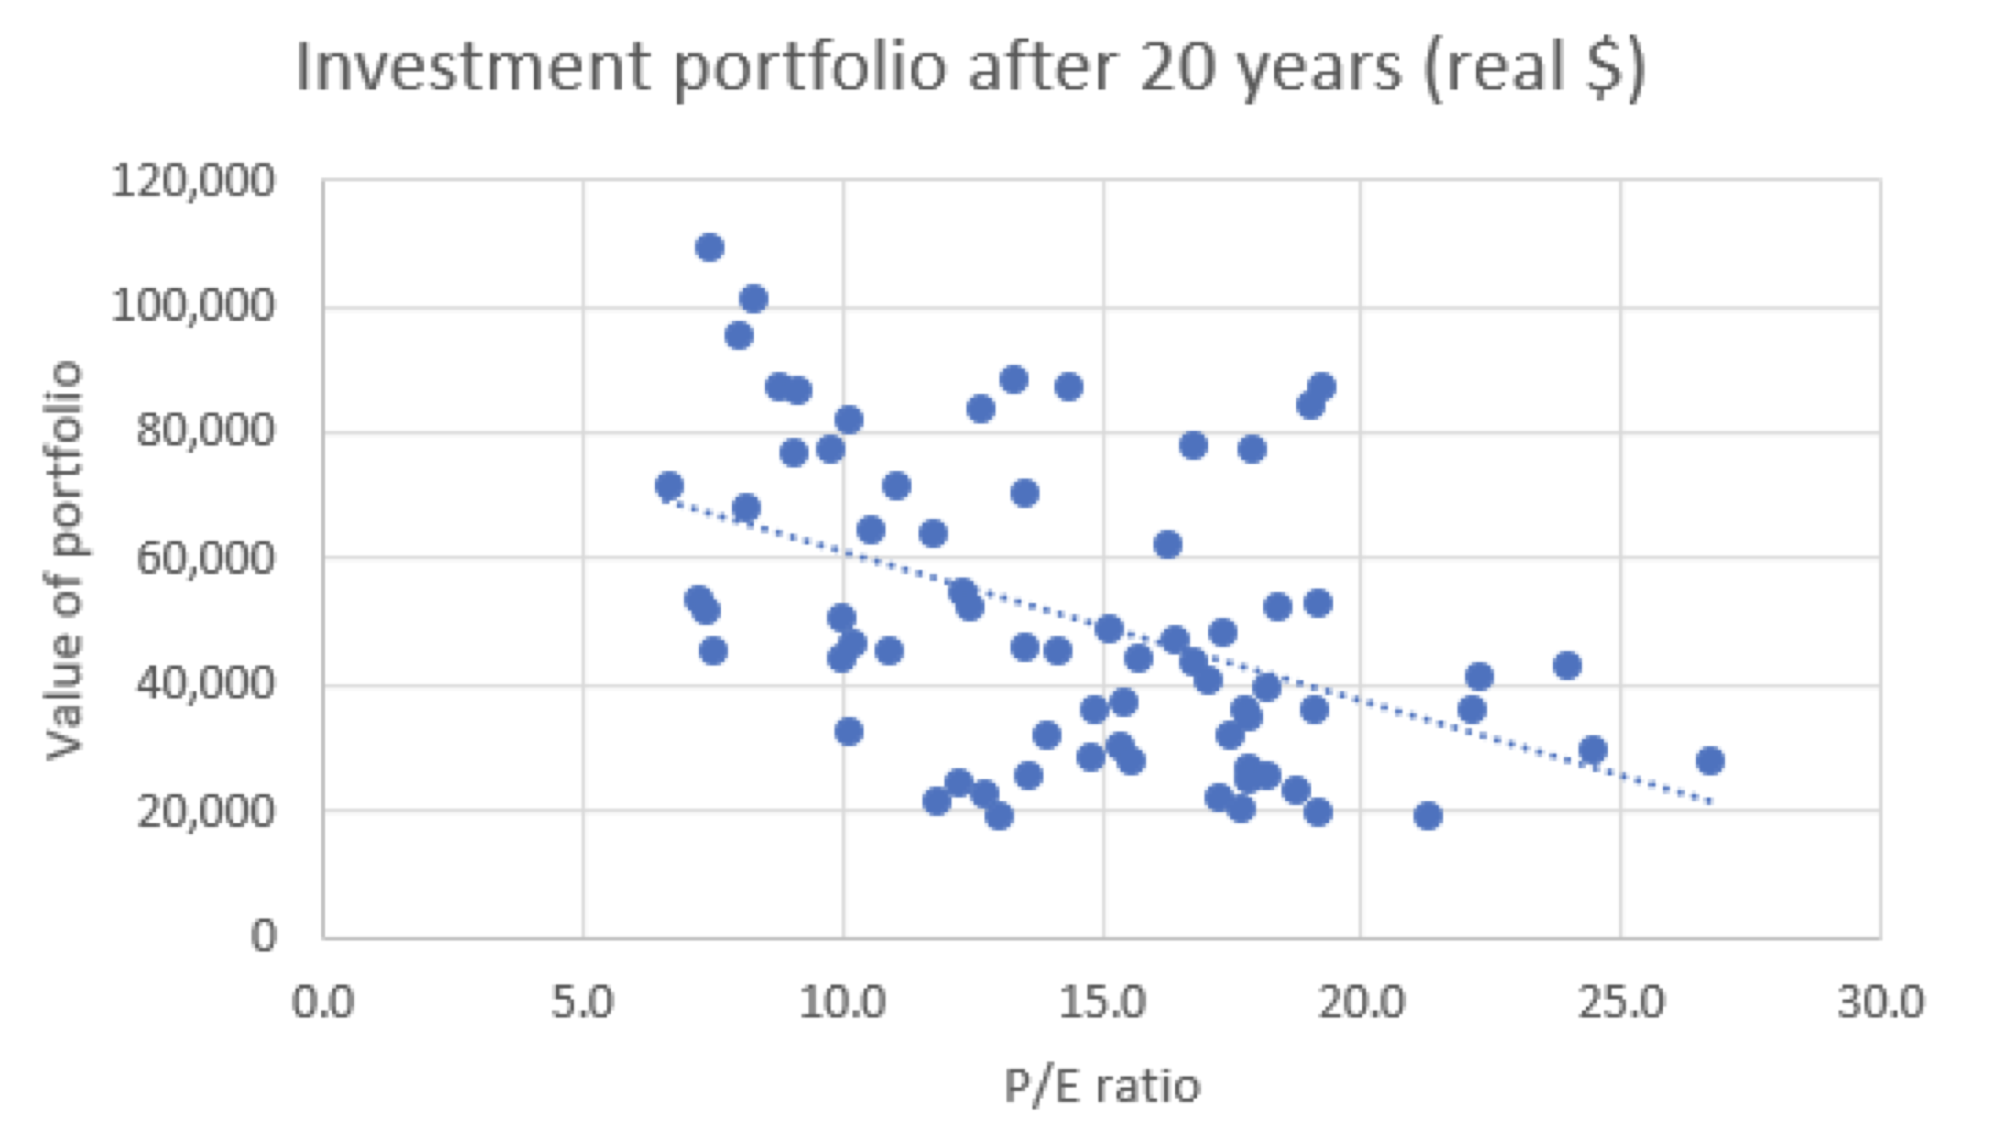
Now, some readers might argue this is true for a one-off investment, but what about a strategy that buys regular parcels of the index over time? Well, the chart below shows the total inflation-adjusted dollars at the end of 20 years for a strategy that invests $1,000 in the market at the start of each year. As can be seen, starting the strategy at a time when markets are expensive tends to result in a smaller portfolio 20 years down the track than when markets are cheap. This suggests that even a buy-regularly-and-hold strategy is affected by its starting point in the market cycle.
All of this does not mean that investors should start trying to time the market, and plenty of research cautions against trying to do so. Given where we are in the market cycle – elevated market P/Es and lower prospective future returns on average – what it does mean is that investors should consider protecting against the downside, even if they intend to spend a long time in the market.
To illustrate this point, consider an investor who, through prudent stock selection on the long side and shorting low quality, overvalued businesses, can build a portfolio that captures 90% of the market upside but only 30% of the downside. Such a portfolio will outperform the market in over 75% of all 20-year periods since 1927 and 97% of all such periods with an initial P/E of 15x or greater1. What is more interesting, however, is that for the six 20-year periods where the starting P/E was higher than 20x, the outperformance versus the market was ~230 bps p.a., while for the six periods with the lowest starting P/Es (between 6.6x and 8.0x), the underperformance was only ~50 bps p.a. This again highlights both i) on average, lower future market returns when current prices are elevated, and ii) the importance of protecting against the downside, even over decades-long investment horizons.
Ultimately, while important, it is not an investor’s time in the market that determines their overall returns, but rather their ability to protect against the downside. The mean-reverting nature of asset prices means that even a long time in the market might not make up for the initial overpayment. Investors who can protect against the downside, especially when market valuations are stretched, can stand to generate attractive equity returns over time regardless of where they are in the market cycle.
****
1 Over the 90 years between 1927 and 2017, a strategy that captured 90% of the market upside but only 30% of the downside would have generated an annualised nominal return of 11.7% compared to the 9.7% annual return of the S&P 500. $100 invested in this strategy at the start of 1927 would have grown to $2.1 million by the end of 2017, compared to $400,000 for the S&P 500.
![]() Daniel Wu is a Research Analyst with Montaka Global Investments. To learn more about Montaka, please call +612 7202 0100.
Daniel Wu is a Research Analyst with Montaka Global Investments. To learn more about Montaka, please call +612 7202 0100.