The collective performance of the stocks of Facebook, Amazon, Apple, Netflix and Google (now Alphabet) has been sensational over the last few years. Combined with their sheer scale, the stocks of these companies have therefore accounted for the bulk of the US equity market’s gains in this time. So, it comes as no surprise that market participants and commentators alike have been quick to point to the FAANG phenomenon as a key driver of what has become an unusually narrow and consistent driver of stock market performance – and perhaps as a reason for their own underperformance, or maybe just to grab a headline. It may then come as a surprise to readers that the level of outperformance of the few star performers recently is not very unusual, nor is it unusually long-lasting, when viewed in an historical context.
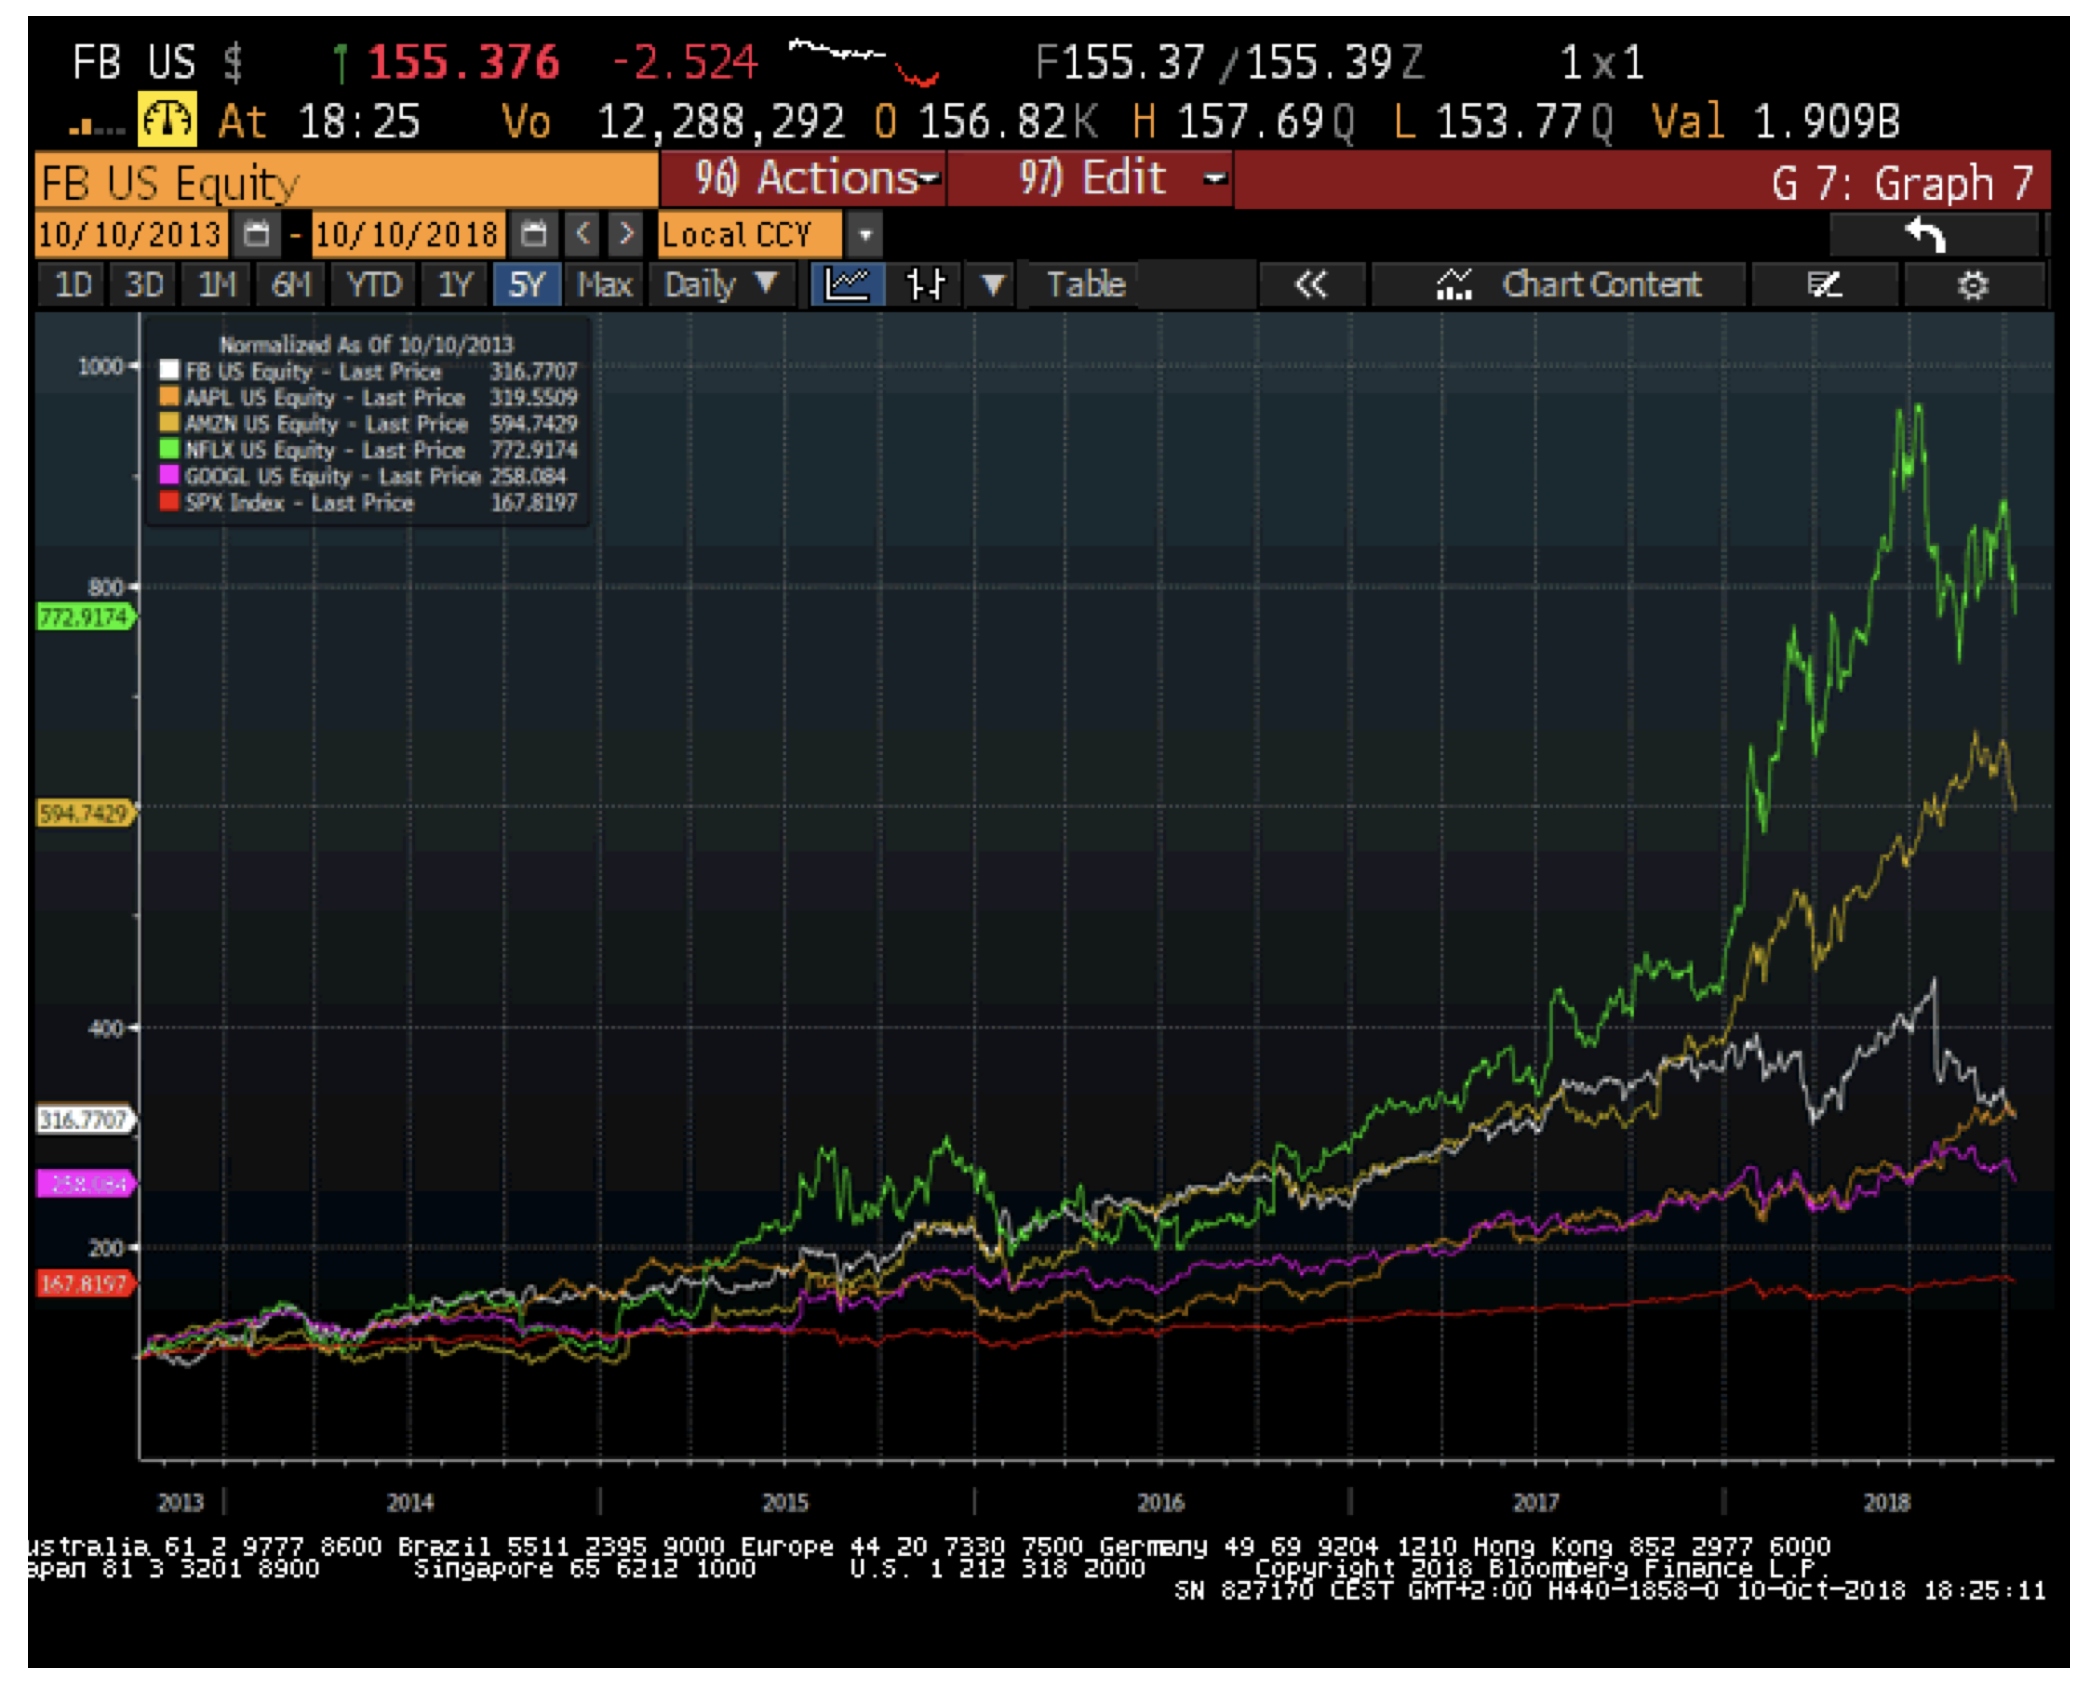
The US equity market is now experiencing its longest-ever bull market in history. Since a low-point marked by the Global Financial Crisis in March 2009, the S&P500, a measure of US stock prices, has more than quadrupled in value. In the last five years the index is up around 70%. But this is dwarfed by the returns of the so-called FAANG stocks: Facebook, Amazon, Apple, Netflix and Google (now Alphabet to be precise). You can see this from the following chart. Google is the “laggard” of the group, up 2.6-times in five years, whereas Netflix leads the pack, up an astounding 8-fold – or near enough.
FAANG vs the S&P500 over the past five years
Over the last year FAANG’s returns have been similarly impressive, except for Facebook (down about 10%, underperforming the index by almost 22%) and maybe Google (a touch above the index right now). Still Netflix and Amazon have outperformed by 60% and 72%, respectively. See the next chart.
FAANG vs the S&P500 over the past 12 months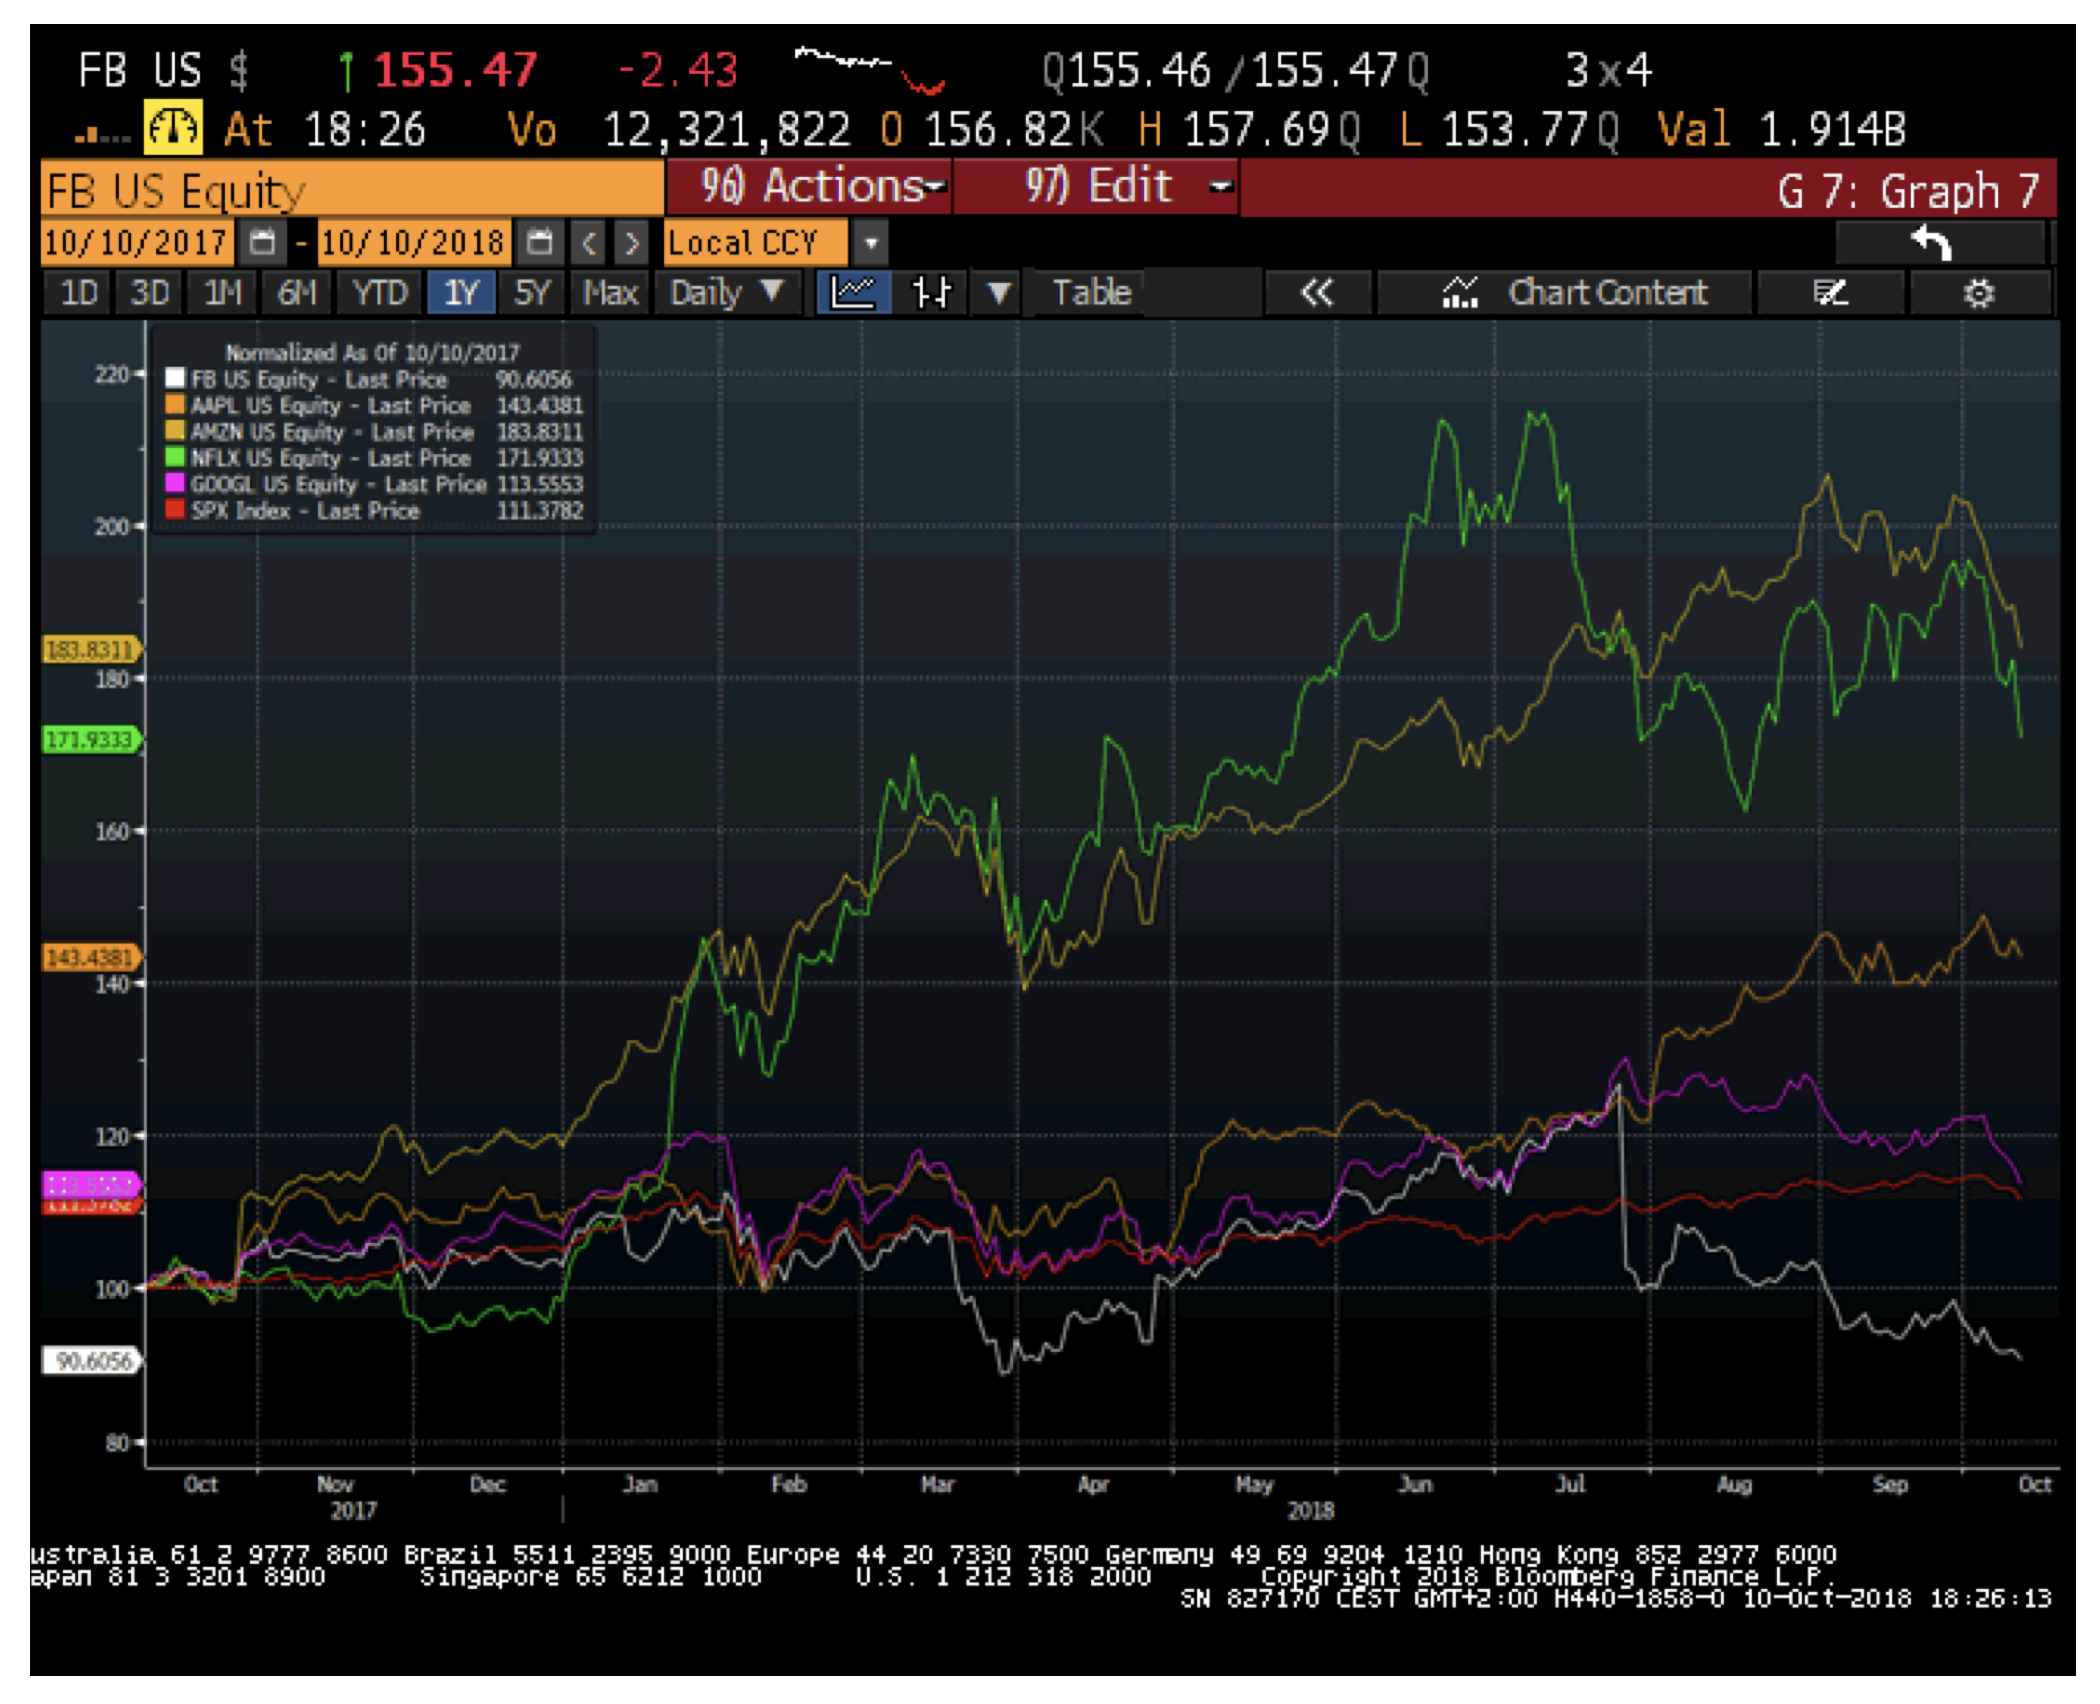
It certainly appears that the US equity market has been “narrow” for some time now. And the narrowness – as defined qualitatively by the dominance of just a few stellar performances within the group – seems to have been quite persistent. To get a feel for how this compares to historically we lean on the analysis of the quantitative research division of UBS, a large Swiss bank and broker.
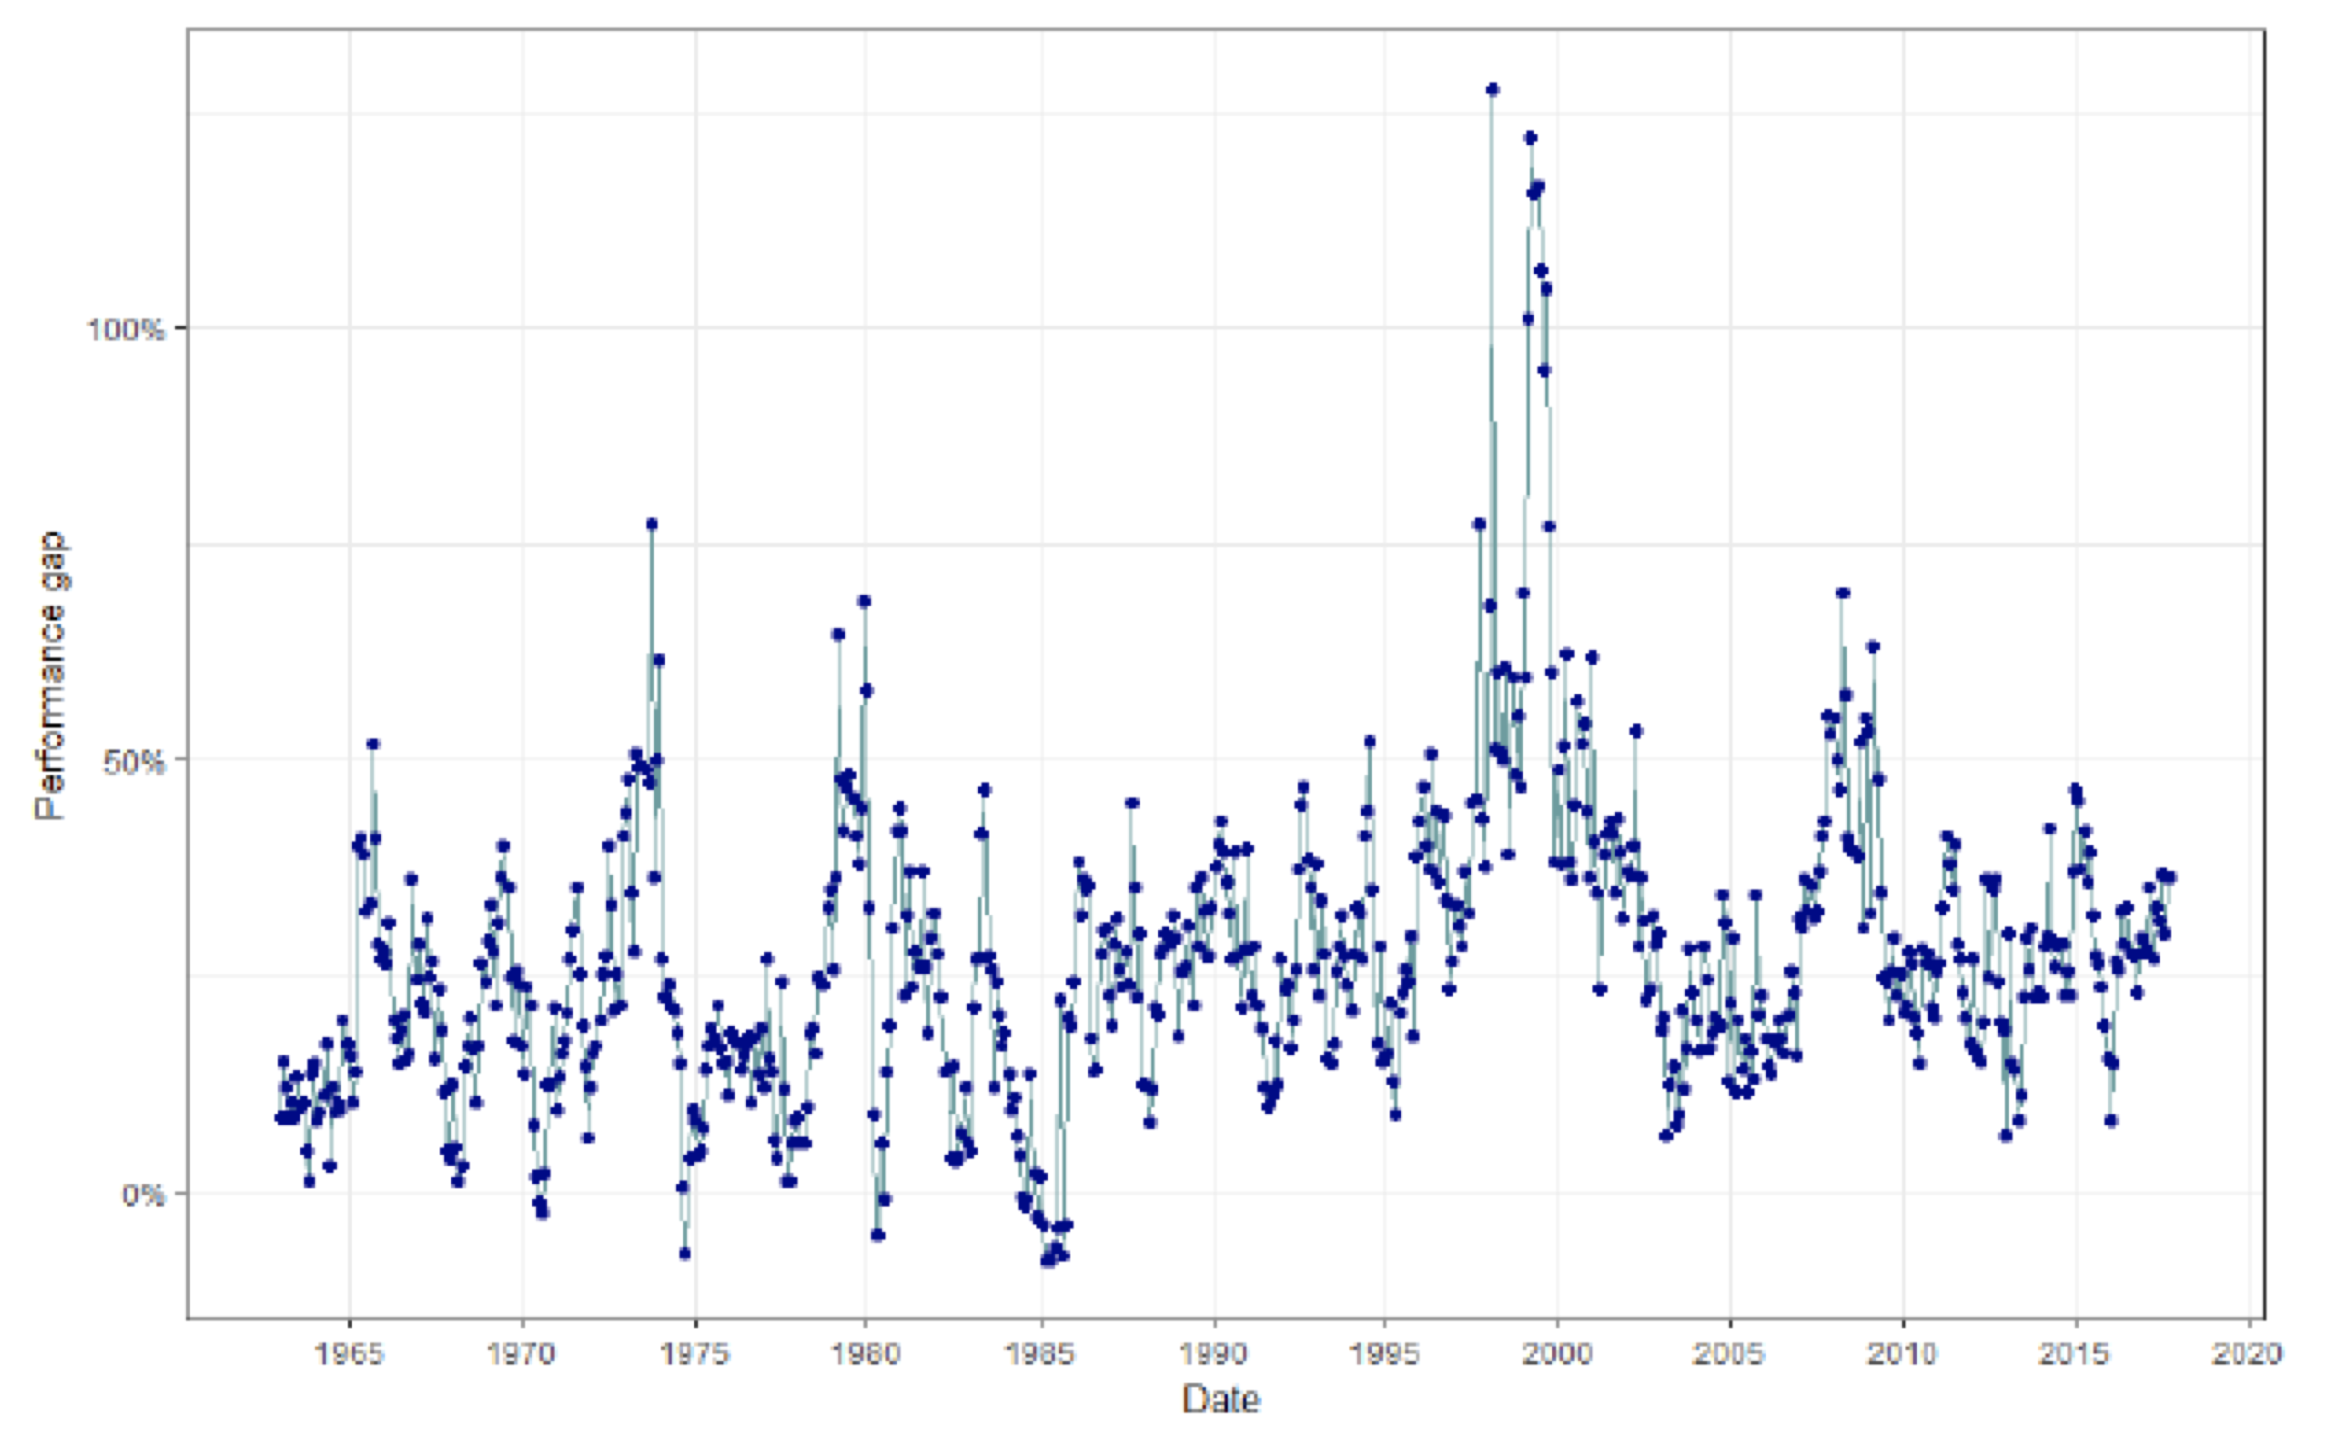
Recently, UBS went through an exercise to determine the outperformance of the top contributors to the S&P500 over time. At each month end going back to 1962 the team identified the top five contributors to the index return (a function of share price performance and capitalisation or size of the company) over the next year. They then computed the return to a portfolio of these stocks and a portfolio of the S&P500 excluding these stocks over that year. The following chart reproduced from the UBS report shows the performance gap between the two portfolios which is typically between 9% and 45%, with an average level of 27%.
Average performance gap between the top five contributors to the S&P500 return and the rest of the stocks in the S&P500
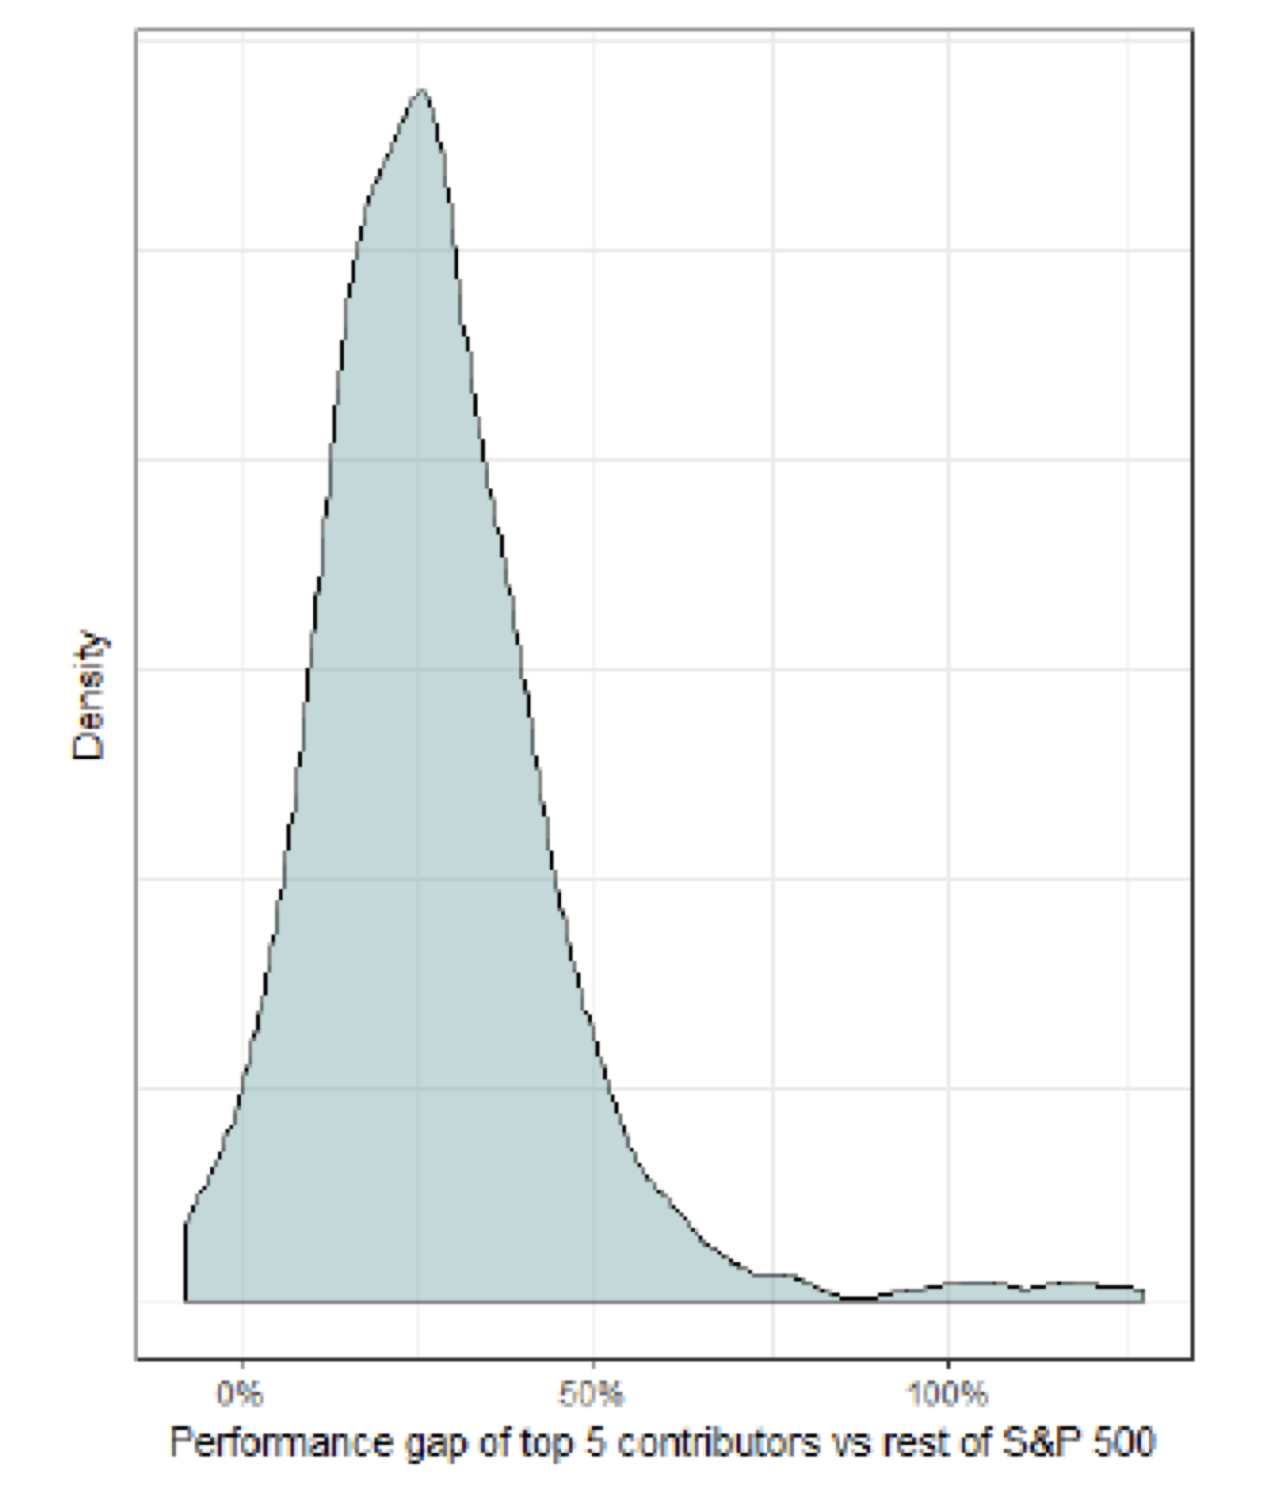
Coming back to today and our FAANGS, we note that over the past year (to 26 Sep 2018, in line with the UBS analysis) the top five contributors to the S&P500 have been: Amazon, Apple, Microsoft, Berkshire Hathaway and Google. The list includes three FAANGs. A portfolio including these five stocks would have appreciated by about 50% in the past year. By contrast, a portfolio holding the other 495 stocks would have gained about 14% in the same period, resulting in a performance gap of 36%. This is not out of line with the level of annual outperformance by the top five contributors seen over the last half a century. To punctuate the point, see the empirical distribution of the performance gap in the chart below – 36% is well within the realm of normalcy.
Empirical distribution of the “performance gap” since 1962
UBS then moved on to a study of consistency. After all it seems that the FAANGs have been outperforming for quite a while, so it is worth understanding how long outperformance of the top stocks typically lasts. To do this UBS took the top five contributors to the index return for the subsequent 12 months on each date and then repeated the exercise for the same day a year later. They then counted how many names were common to both lists of five stocks, giving a number between zero (a completely new list of top performers one year later i.e. no consistency) and five (a total overlap i.e. complete consistency).
As we might expect the level of consistency, of top contributors remaining top contributors, has indeed been increasing in recent years. However, when we look back over a long period it becomes clear that the starting point was low. In the period from 2000 to 2010 the market demonstrated unusually low levels of consistency and only now are we seeing a return to more historically normal consistency levels. Below is a chart showing the rolling 24-month average count. It doesn’t appear that the top five names are any more persistent now than they have been in so many decades past.
Average number of top five contributing stocks still in the top five contributors one year later
It is easy to be carried away by the stellar performance of a handful of stocks, especially when those companies have been disruptive, or the topic of their sustainability has been so controversial. However, it is worth pausing and reflecting on where we stand in the pattern of history. We may not be experiencing anything that is so special when we zoom out a few years, or a decade, or a century, or more. Rather, it may be that we are faced with ever-changing economies, technologies and markets almost all the time. At Montaka, we prefer not to hide behind that nor sensationalise it, rather to understand it and profit form the opportunities presented for our clients.
Montaka owns shares in Facebook (Nasdaq:FB), Apple (Nasdaq: AAPL) and Alphabet (Nasdaq:GOOGL)
 Christopher Demasi is a Portfolio Manager with Montaka Global Investments.
To learn more about Montaka, please call +612 7202 0100.
How Deep is Your Market?
The collective performance of the stocks of Facebook, Amazon, Apple, Netflix and Google (now Alphabet) has been sensational over the last few years. Combined with their sheer scale, the stocks of these companies have therefore accounted for the bulk of the US equity market’s gains in this time. So, it comes as no surprise that market participants and commentators alike have been quick to point to the FAANG phenomenon as a key driver of what has become an unusually narrow and consistent driver of stock market performance – and perhaps as a reason for their own underperformance, or maybe just to grab a headline. It may then come as a surprise to readers that the level of outperformance of the few star performers recently is not very unusual, nor is it unusually long-lasting, when viewed in an historical context.
The US equity market is now experiencing its longest-ever bull market in history. Since a low-point marked by the Global Financial Crisis in March 2009, the S&P500, a measure of US stock prices, has more than quadrupled in value. In the last five years the index is up around 70%. But this is dwarfed by the returns of the so-called FAANG stocks: Facebook, Amazon, Apple, Netflix and Google (now Alphabet to be precise). You can see this from the following chart. Google is the “laggard” of the group, up 2.6-times in five years, whereas Netflix leads the pack, up an astounding 8-fold – or near enough.
FAANG vs the S&P500 over the past five years
Over the last year FAANG’s returns have been similarly impressive, except for Facebook (down about 10%, underperforming the index by almost 22%) and maybe Google (a touch above the index right now). Still Netflix and Amazon have outperformed by 60% and 72%, respectively. See the next chart.
FAANG vs the S&P500 over the past 12 months
It certainly appears that the US equity market has been “narrow” for some time now. And the narrowness – as defined qualitatively by the dominance of just a few stellar performances within the group – seems to have been quite persistent. To get a feel for how this compares to historically we lean on the analysis of the quantitative research division of UBS, a large Swiss bank and broker.
Recently, UBS went through an exercise to determine the outperformance of the top contributors to the S&P500 over time. At each month end going back to 1962 the team identified the top five contributors to the index return (a function of share price performance and capitalisation or size of the company) over the next year. They then computed the return to a portfolio of these stocks and a portfolio of the S&P500 excluding these stocks over that year. The following chart reproduced from the UBS report shows the performance gap between the two portfolios which is typically between 9% and 45%, with an average level of 27%.
Average performance gap between the top five contributors to the S&P500 return and the rest of the stocks in the S&P500
Coming back to today and our FAANGS, we note that over the past year (to 26 Sep 2018, in line with the UBS analysis) the top five contributors to the S&P500 have been: Amazon, Apple, Microsoft, Berkshire Hathaway and Google. The list includes three FAANGs. A portfolio including these five stocks would have appreciated by about 50% in the past year. By contrast, a portfolio holding the other 495 stocks would have gained about 14% in the same period, resulting in a performance gap of 36%. This is not out of line with the level of annual outperformance by the top five contributors seen over the last half a century. To punctuate the point, see the empirical distribution of the performance gap in the chart below – 36% is well within the realm of normalcy.
Empirical distribution of the “performance gap” since 1962
UBS then moved on to a study of consistency. After all it seems that the FAANGs have been outperforming for quite a while, so it is worth understanding how long outperformance of the top stocks typically lasts. To do this UBS took the top five contributors to the index return for the subsequent 12 months on each date and then repeated the exercise for the same day a year later. They then counted how many names were common to both lists of five stocks, giving a number between zero (a completely new list of top performers one year later i.e. no consistency) and five (a total overlap i.e. complete consistency).
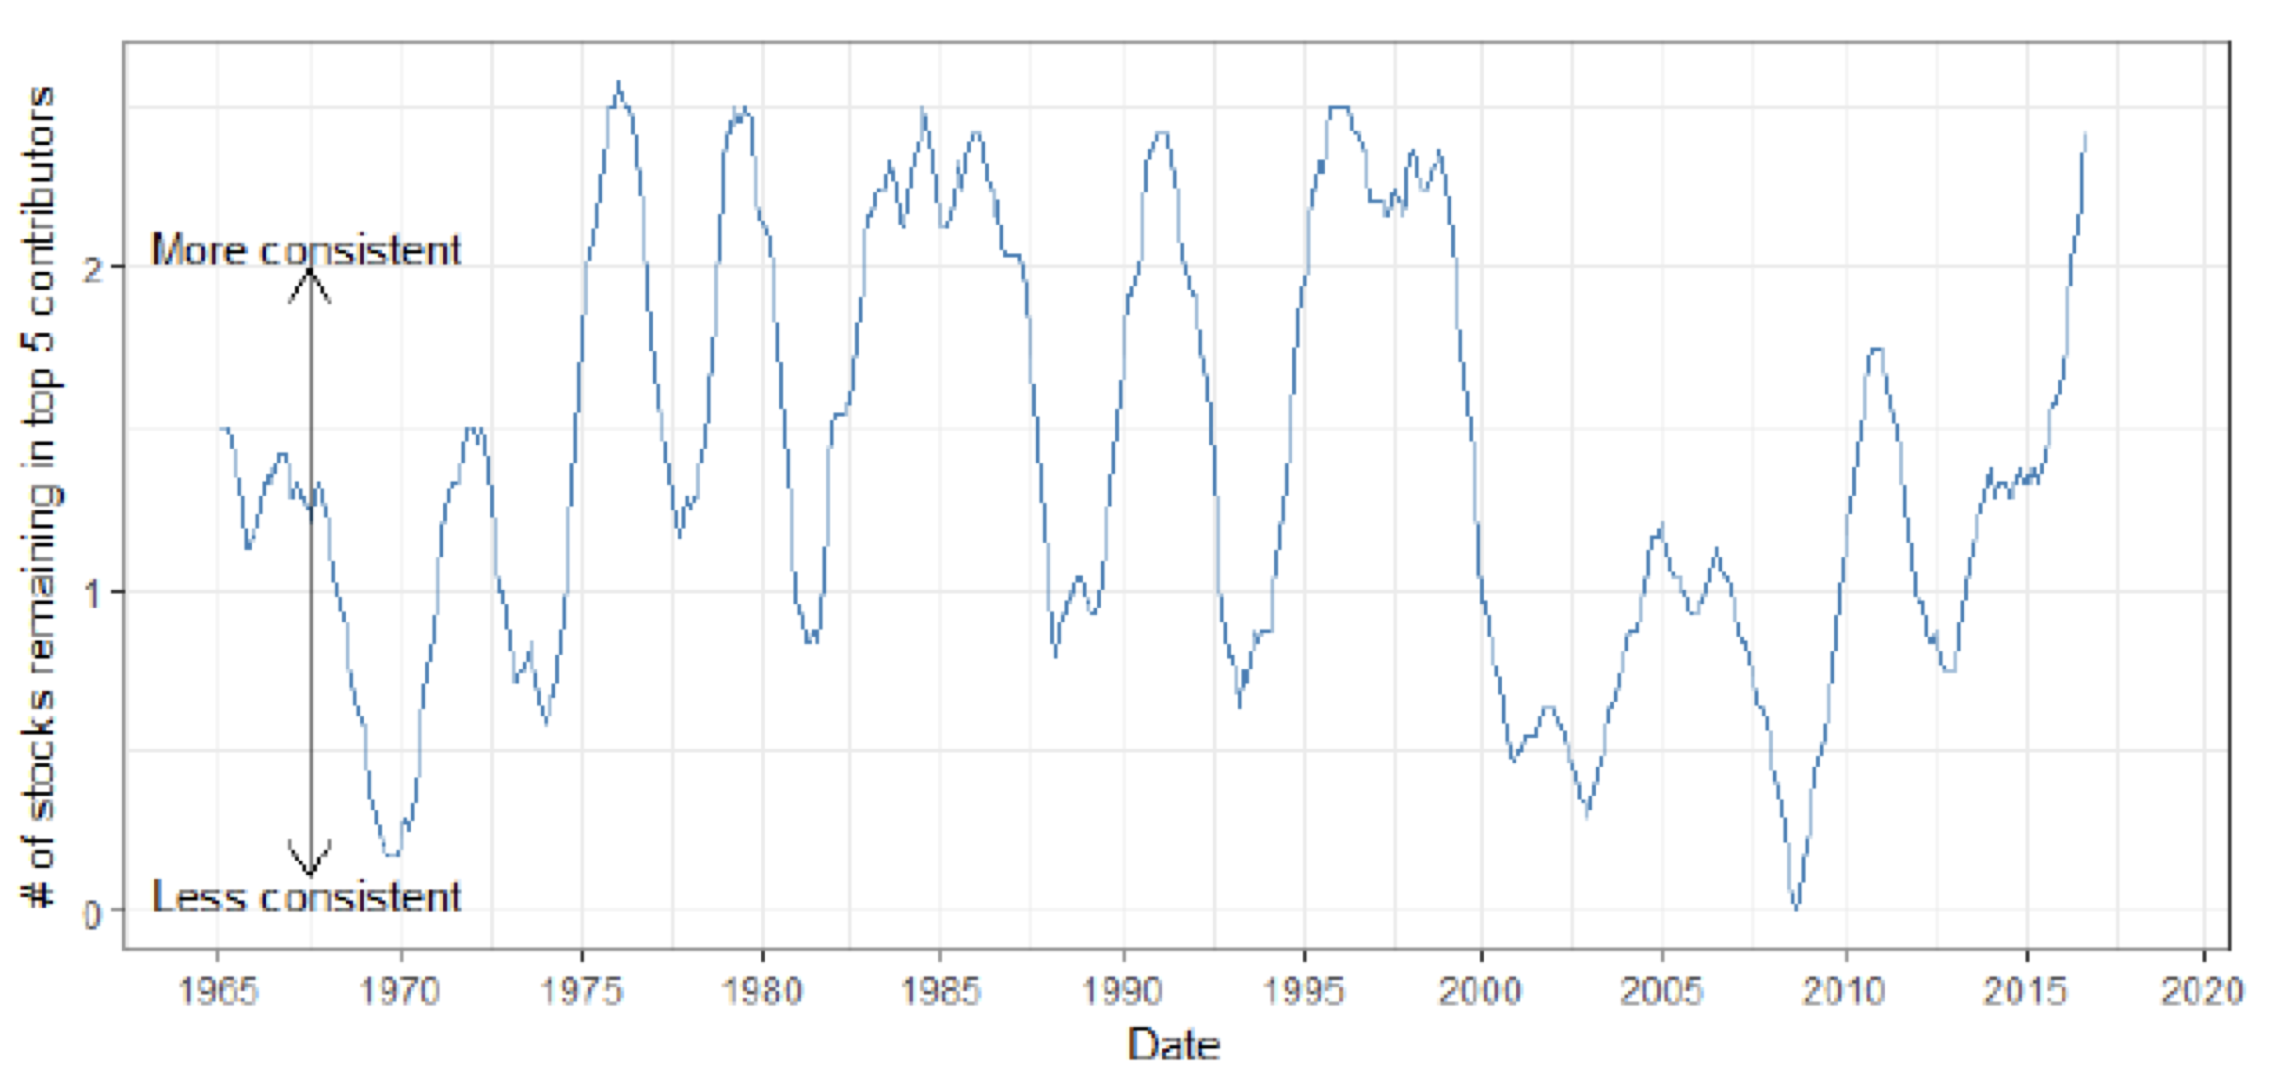
As we might expect the level of consistency, of top contributors remaining top contributors, has indeed been increasing in recent years. However, when we look back over a long period it becomes clear that the starting point was low. In the period from 2000 to 2010 the market demonstrated unusually low levels of consistency and only now are we seeing a return to more historically normal consistency levels. Below is a chart showing the rolling 24-month average count. It doesn’t appear that the top five names are any more persistent now than they have been in so many decades past.
Average number of top five contributing stocks still in the top five contributors one year later
It is easy to be carried away by the stellar performance of a handful of stocks, especially when those companies have been disruptive, or the topic of their sustainability has been so controversial. However, it is worth pausing and reflecting on where we stand in the pattern of history. We may not be experiencing anything that is so special when we zoom out a few years, or a decade, or a century, or more. Rather, it may be that we are faced with ever-changing economies, technologies and markets almost all the time. At Montaka, we prefer not to hide behind that nor sensationalise it, rather to understand it and profit form the opportunities presented for our clients.
Montaka owns shares in Facebook (Nasdaq:FB), Apple (Nasdaq: AAPL) and Alphabet (Nasdaq:GOOGL)
To learn more about Montaka, please call +612 7202 0100.
This content was prepared by Montaka Global Pty Ltd (ACN 604 878 533, AFSL: 516 942). The information provided is general in nature and does not take into account your investment objectives, financial situation or particular needs. You should read the offer document and consider your own investment objectives, financial situation and particular needs before acting upon this information. All investments contain risk and may lose value. Consider seeking advice from a licensed financial advisor. Past performance is not a reliable indicator of future performance.
How Deep is Your Market?
This content was prepared by Montaka Global Pty Ltd (ACN 604 878 533, AFSL: 516 942). The information provided is general in nature and does not take into account your investment objectives, financial situation or particular needs. You should read the offer document and consider your own investment objectives, financial situation and particular needs before acting upon this information. All investments contain risk and may lose value. Consider seeking advice from a licensed financial advisor. Past performance is not a reliable indicator of future performance.
Related Insight
Share
Get insights delivered to your inbox including articles, podcasts and videos from the global equities world.