|
Getting your Trinity Audio player ready...
|
– Chris Demasi & Andrew Macken
The first rule of compounding: never interrupt it unnecessarily.
– Charlie Munger
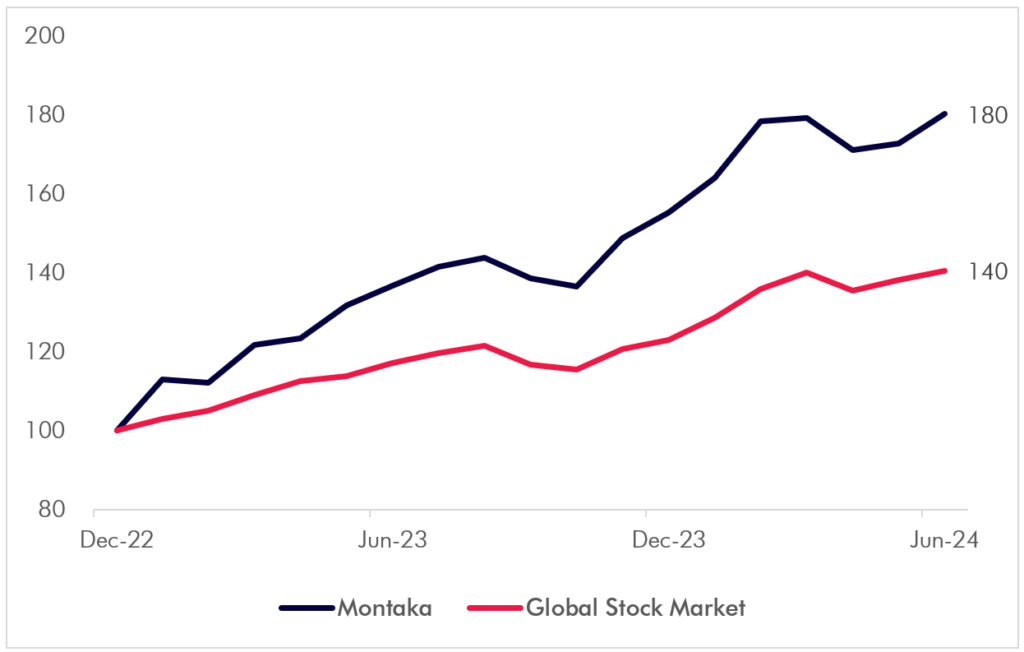
For more than 18 months now the stock market has been on a tremendous run and Montaka’s performance has been outstanding.
While most investors are delighted by the results, some are also uneasy about what comes next. They have asked us if the market has risen too fast too soon; if it’s too concentrated in a handful of stocks; and if the portfolio still offers excellent value like it did previously.
When we examine the current market dynamics, we find that the recent performance and dominance of tech stocks shouldn’t be so concerning. And when we examine our portfolio, we find that it is still offering fantastic long-term value.
We have also been asked if we are changing the portfolio, either to protect against a temporary pullback or to benefit from the next move in the market.
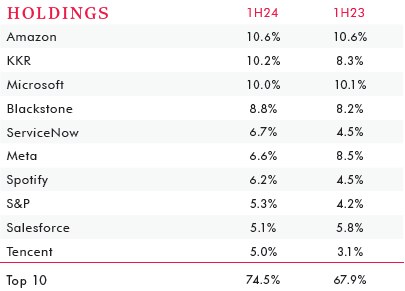
But we have largely left the portfolio unchanged, especially among the top holdings, including Microsoft, Amazon and KKR. That’s because we remain confident the portfolio will create far greater value in the future than it already has today.
MOGL and MSCI Performance Last 18 Months (Indexed to 100 at 31 Dec 2022)
Montaka Top 10 Holdings (Position Sizes at 1H24 Compared to 1H23)
Market dynamics: 2023 redux?
So far, 2024 has looked a lot like 2023.
Stocks have rallied strongly again this year.
The S&P500 index of the largest US companies was up by more than 14% in the first half and hit a new all-time high in July. It looks a lot like last year when the market had advanced 16% by midway through the year and was on its way to a new record.
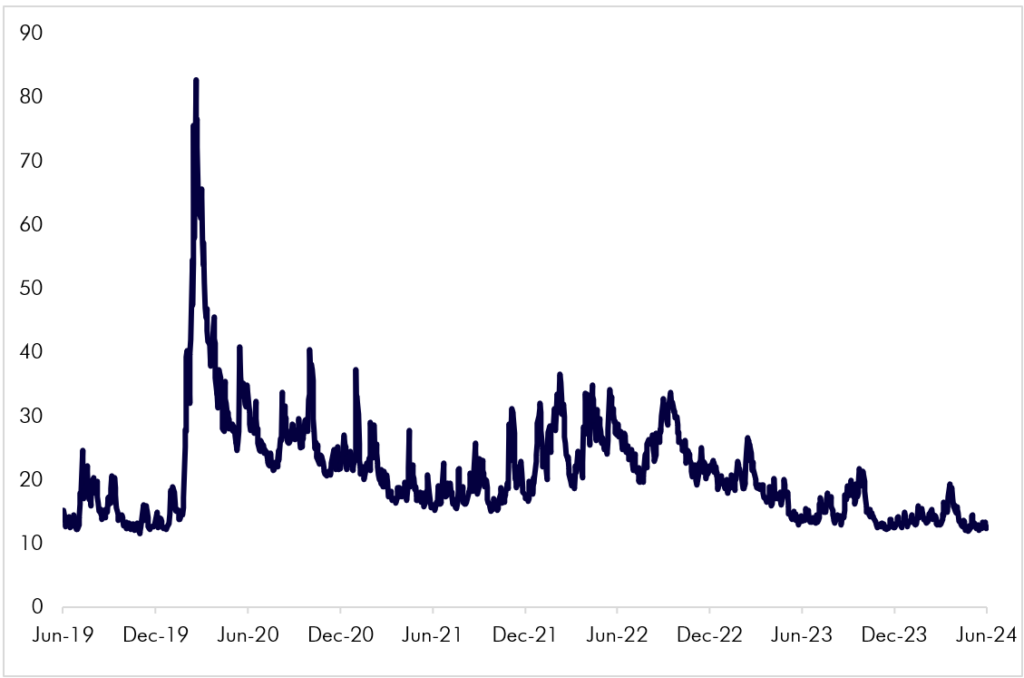
In both years volatility has been remarkably low, too.
The VIX index, which measures the volatility of the S&P500, started 2023 above its long run average of 18. But by the middle of the year, it had fallen to 14. This year the VIX sunk to 12, a level not seen for more than four years.
VIX Index Last 5 Years
And while the S&P500 has had daily swings of 2% or more 15 times a year on average in the past decade, in the last year there has been just one such day.
But the market’s steady rise has belied highly varied performance among individual stocks.
The tendency of stock prices move together – or correlation, as measured by the CBOE Implied Correlation Index – has never been lower.
CBOE Implied Correlation Index Last 5 Years
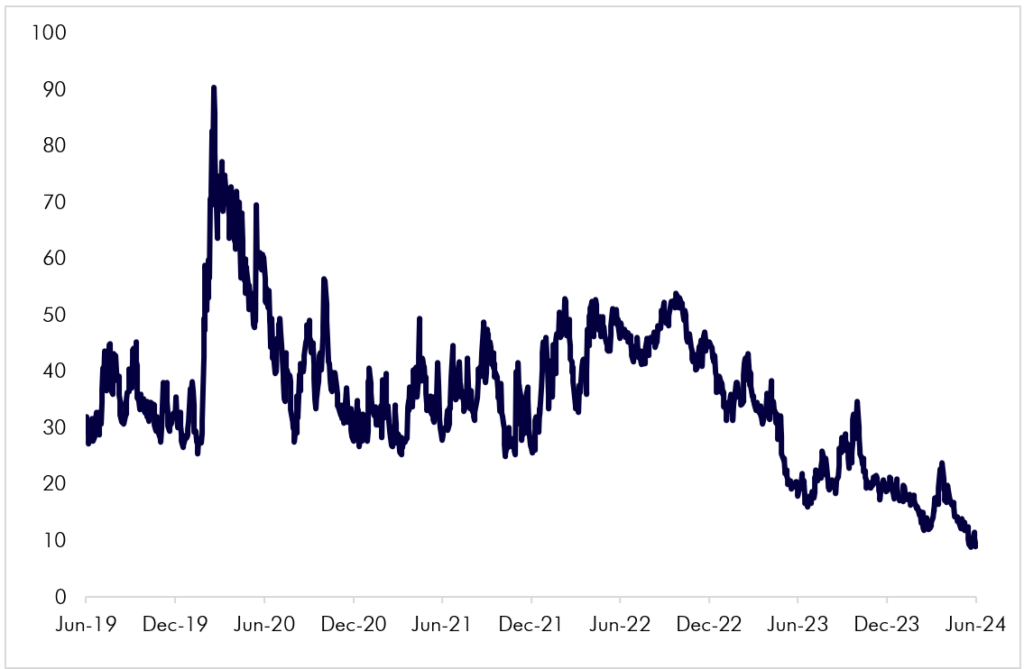
Meanwhile dispersion, or the amount by which stock prices move compared to each other, is near the high end of its historical range as measured by the CBOE S&P500 Dispersion Index.
That’s meant the market has been bifurcating into winners and losers.
And just like last year, the winners have been a few big tech leaders that have driven most of the market’s gains again this
year.
The ‘Magnificent Seven’ – Microsoft, Apple, Nvidia, Google, Amazon, Meta and Tesla – accounted for almost 80% of the increase in the S&P500 in 2023. In the first half of 2024, they accounted for 60% of the increase.
But that alone shouldn’t worry investors.
This is a typical market dynamic
The dominance of big tech, again, might appear striking.
However, this ‘power law’ phenomenon – where a handful of stocks power most of the gains – is typical in equity markets.
We have often cited the seminal research of Professor Hendrik Bessembinder of Arizona State University. He found that just 4% of stocks accounted for all the US$35 trillion of wealth created in the US stock market from 1926 to 2016.
Bessembinder recently updated his research, extending the study to global stocks, covering 64,000 companies across 43 countries, from 1990 to 2020.
The results showed that the original findings in the US were no fluke.
In fact, global stock market returns were even more skewed, with just 2.4% of stocks accounting for all the US$76 trillion of shareholder wealth created.
Tech’s dominance is structural
The market’s narrow performance has been the result of the biggest companies delivering the best performance.
As the Magnificent Seven have become enormous, so has their impact on the market.
Their total market capitalisation stands at almost $16 trillion, representing about one third of the value of the S&P500. That’s up from 30% at the beginning of this year and just over 20% in the middle of last year.
Although many worry this level of market concentration is too high, we think it reflects the importance of these companies and it is still much lower than some levels seen in the past.
We recently explained the structural tendency of mega-cap tech companies to capture an outsized share of the market’s value. That’s because technology is becoming a bigger part of the economy, these companies are extending their dominance and AI is a huge boost.
Still, the market share of the Magnificent Seven falls far short of the US rail companies in the early 20th century, when they made up two-thirds of the US stock market’s value.
Putting price rises into context
And if we step back, the price gains aren’t as dramatic as they first seem.
Despite the Magnificent Seven growing to colossal size, their stock prices have continued to outpace the rest of the market.
This year their weighted average share price appreciated by 31% compared to 8% for the other 493 stocks. They were up 60% in the first half of last year, compared to 4% for the rest.
After soaring so high so quickly, it’s understandable that many doubt that the big tech companies can keep strongly outperforming.
We are aware that trees do not grow to the sky, but it is important to put these results in perspective before drawing conclusions.
Firstly, Nvidia alone accounted for around half of the group’s performance this year as its stock price skyrocketed two and a half times in the first six months. That followed a tripling in
2023.
Nvidia has taken advantage of its stranglehold on the insatiable demand for AI chips in a supply constrained market. Yet we find it difficult to confidently predict its future success, especially with large rivals and customers developing competing chips. As a result, we have not owned the stock.
Secondly, the group’s performance looks much less extreme when it is viewed through the wider aperture of a longer timeframe.
Today, the Magnificent Seven are on average 11% per annum above the peaks they reached before the market sold off heavily in 2022. Without Nvidia that would be just 2% higher and lag the S&P500, which is 5% per annum above its previous high.
Our portfolio in focus
When we examine some of the most important holdings in Montaka’s portfolio we see a similar dynamic.
Montaka Portfolio Holdings Performance
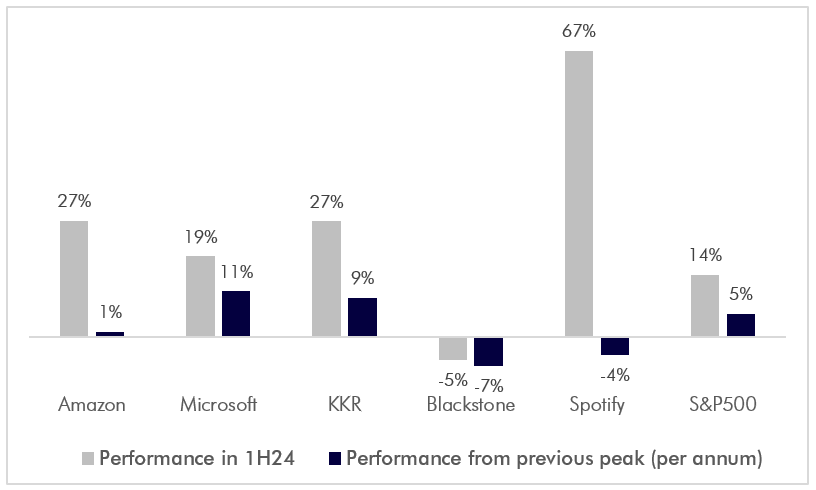
Amazon and Microsoft are among the largest holdings in the portfolio because we believe their leading ‘hyperscale’ cloud platforms – AWS and Azure – will keep winning big from the AI revolution. Together they represent just over 20% of the portfolio’s value.
Amazon and Microsoft surged in the first half, with their stocks up 27% and 19% respectively. This resulted in Amazon surpassing its previous high set three years ago and Microsoft extending the gap above its former peak.
Yet if we look at their annualized returns from their 2021 high points, Amazon’s is just 1% and Microsoft’s is 11%.
Of course, there are other important themes in the portfolio besides AI and cloud computing.
KKR and Blackstone are top holdings as well because we believe they will continue to lead explosive growth in the alternative asset management industry. Together they account for almost 20% of the portfolio.
KKR’s stock gained 27% in the first half, while Blackstone’s share price was down slightly. While that put KKR 26% above its prior high, that’s still just 9% ahead on an annualized basis. And Blackstone is still 17% below its high-water mark reached in late 2021.
(We detailed our investment thesis on KKR this time last year, and Amit has followed that up with a fascinating piece exploring the parallels between KKR and Warren Buffett’s Berkshire
Hathaway.)
Meanwhile, the best performer and the stock that has added the most value to Montaka’s portfolio this year is Spotify – the world’s pre-eminent audio streaming company.
Spotify’s share price soared 67% in the first half. But, again, it is still 14% away from its last peak in early 2021.
Our holdings are excellent value
But perhaps our most important answer to investor’s ‘fear of heights’ after recent strong gains in our portfolio is that past price moves give us very little insight into future value.
When we go deeper and relate share prices to earnings it’s clear our portfolio companies still represent fantastic value for long-term investors.
Investors typically look at share prices compared to the last twelve months of reported earnings or the next twelve months of projected earnings.
Montaka Portfolio Holdings Forward Earnings Multiples
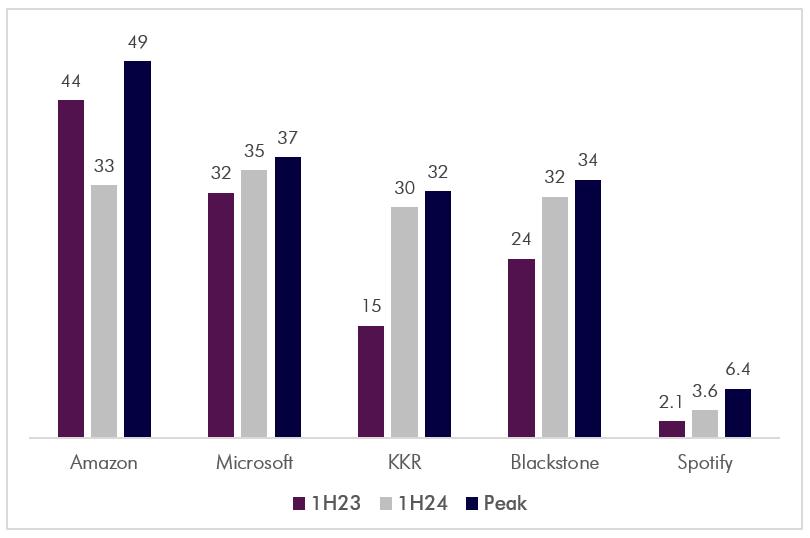
Note: Spotify multiple is price to sales per share (earnings not available in prior periods); for other holdings multiple is price to earnings per share.
Over the past year the multiple of share price to forecast earnings has certainly expanded across Montaka’s main holdings, except for Amazon. And, forward earnings estimates have also increased across the board, substantially in some cases.
The market is no doubt ascribing a higher multiple to earnings that are larger and growing faster now.
We’d point out, however, that these multiples are still lower than when these stocks traded at their previous peaks, some by a wide margin. Yet earnings have improved.
So, we could argue that valuations are the same or better than they were previously.
Still, this type of analysis is very short-sighted.
For companies that can strongly compound their earnings power with a high degree of certainty, like Montaka’s portfolio holdings, it makes sense to look well beyond the next year when
considering their valuation.
We can compare current share prices with estimated earnings five years from now. This approach accounts for the extraordinary growth rates that leading companies can achieve as they transform their industries.
Montaka Portfolio Holdings 5-Year Forward Earnings Multiple
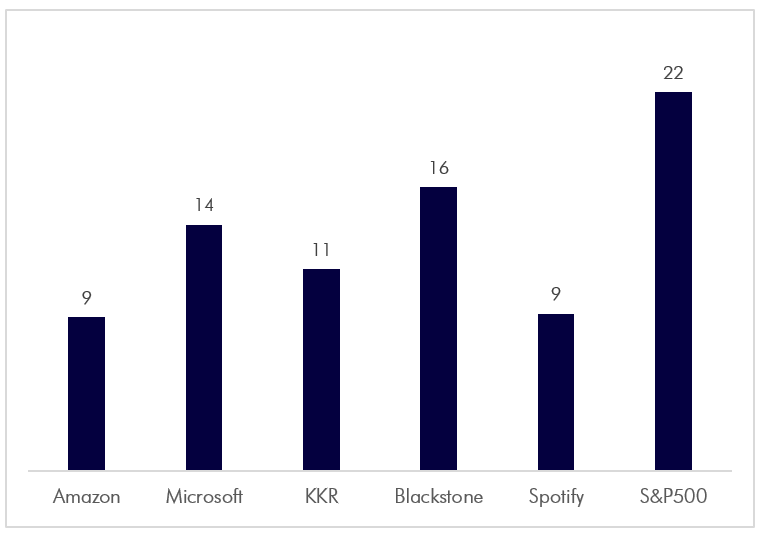
Note: S&P500 multiple is current forward PE multiple.
It then becomes immediately clear that the long-term earnings multiples for Montaka’s main portfolio holdings are low, both absolutely and relative to the market.
In other words, we are accepting a higher multiple, or lower earnings yield, today for a much lower multiple, or higher earnings yield, in the future.
On top of that we expect these companies will still be growing at high rates five years from now because the runway in their markets extends far beyond the end of this decade.
To us that means Montaka’s top portfolio holdings look like excellent value over the longer term.
Podcast: Join the Montaka Global Investments team on Spotify as they chat about the market dynamics that shape their investing decisions in Spotlight Series Podcast. Follow along as we share real-time examples and investing tips that govern our stockpicks. Click below to listen. Alternatively, click on this link: https://podcasters.spotify.com/pod/show/montaka
To request a copy of our latest paper which explores the empirical research around the 3 pillars of active management outperformance, please share your details with us:
Note: Montaka is invested in AMD, Kyndryl; Holdings and LVMH.


