|
Getting your Trinity Audio player ready...
|
Growth comes in different forms, some of which are intuitive and easy for our minds to handle. Unfortunately, simplistic growth models often fail to adequately describe the world around us. Relying on them to make investment decisions can lead to sub-optimal or even dire outcomes. As students of investing this behoves us to explore more adequate growth models and identify the most powerful of them in the investments that we make for our clients.
Straight lines
When it comes to growth human minds tend to think linearly. That is to say that its much simpler for us to handle a constant increment of growth across equivalent frames. It’s the first thing we learn as children. Counting is the first example we encounter: one, two, three. At each interval the amount goes up by one. Counting by two’s is another example. The increment is two rather than one this time, but each count is always two more than the last. We can visualize this as a straight line going from bottom-left to top-right with constant slope.
Visualizing linear growth
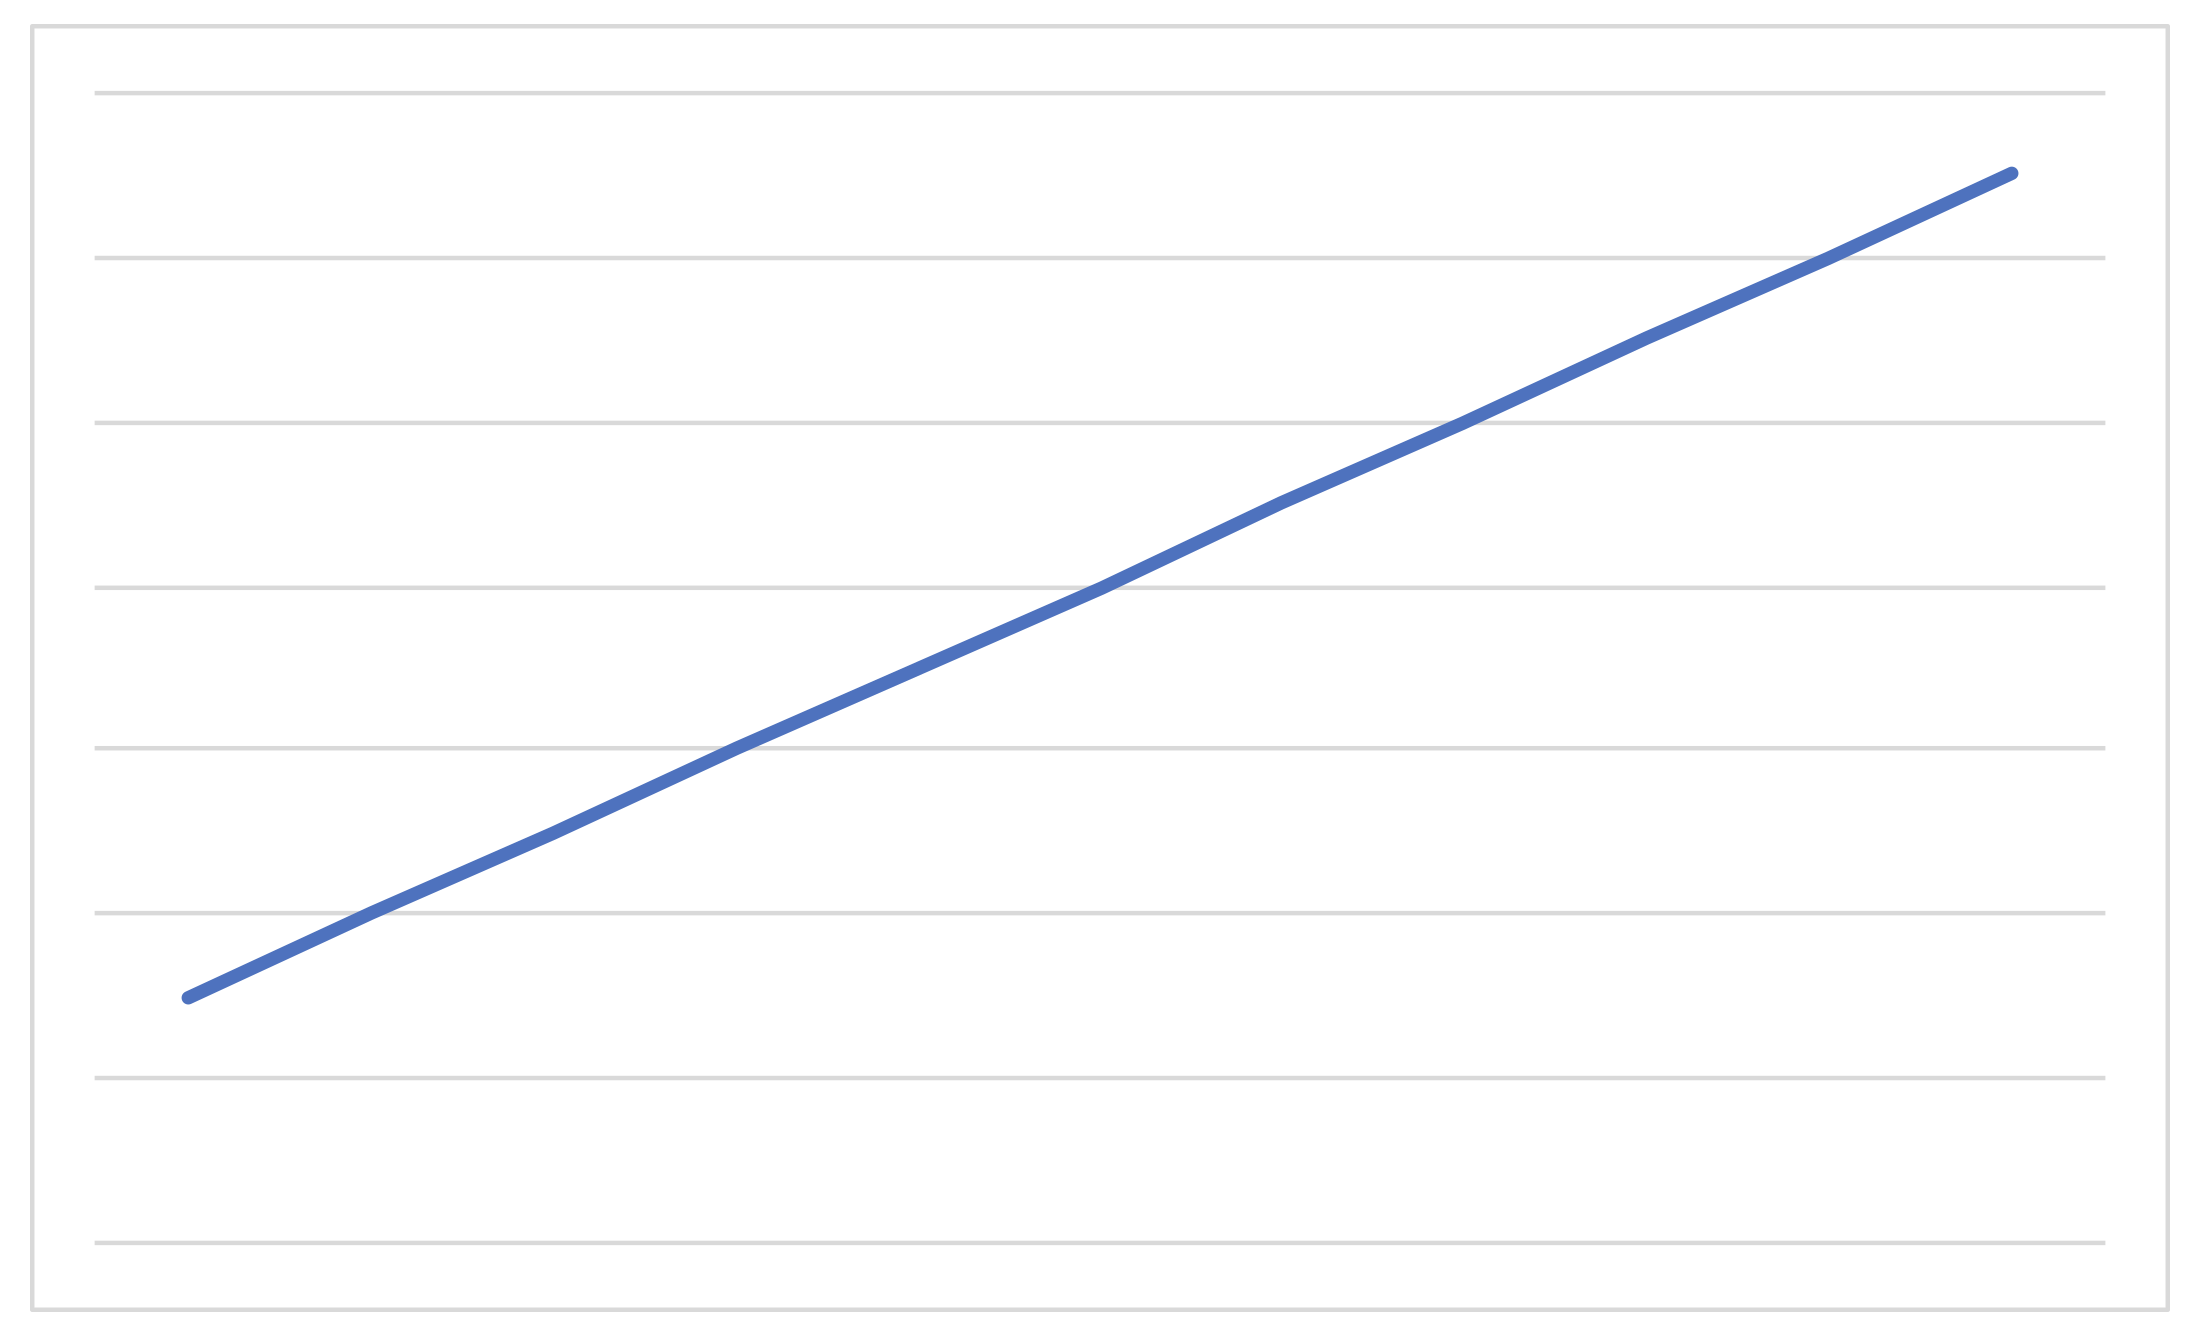
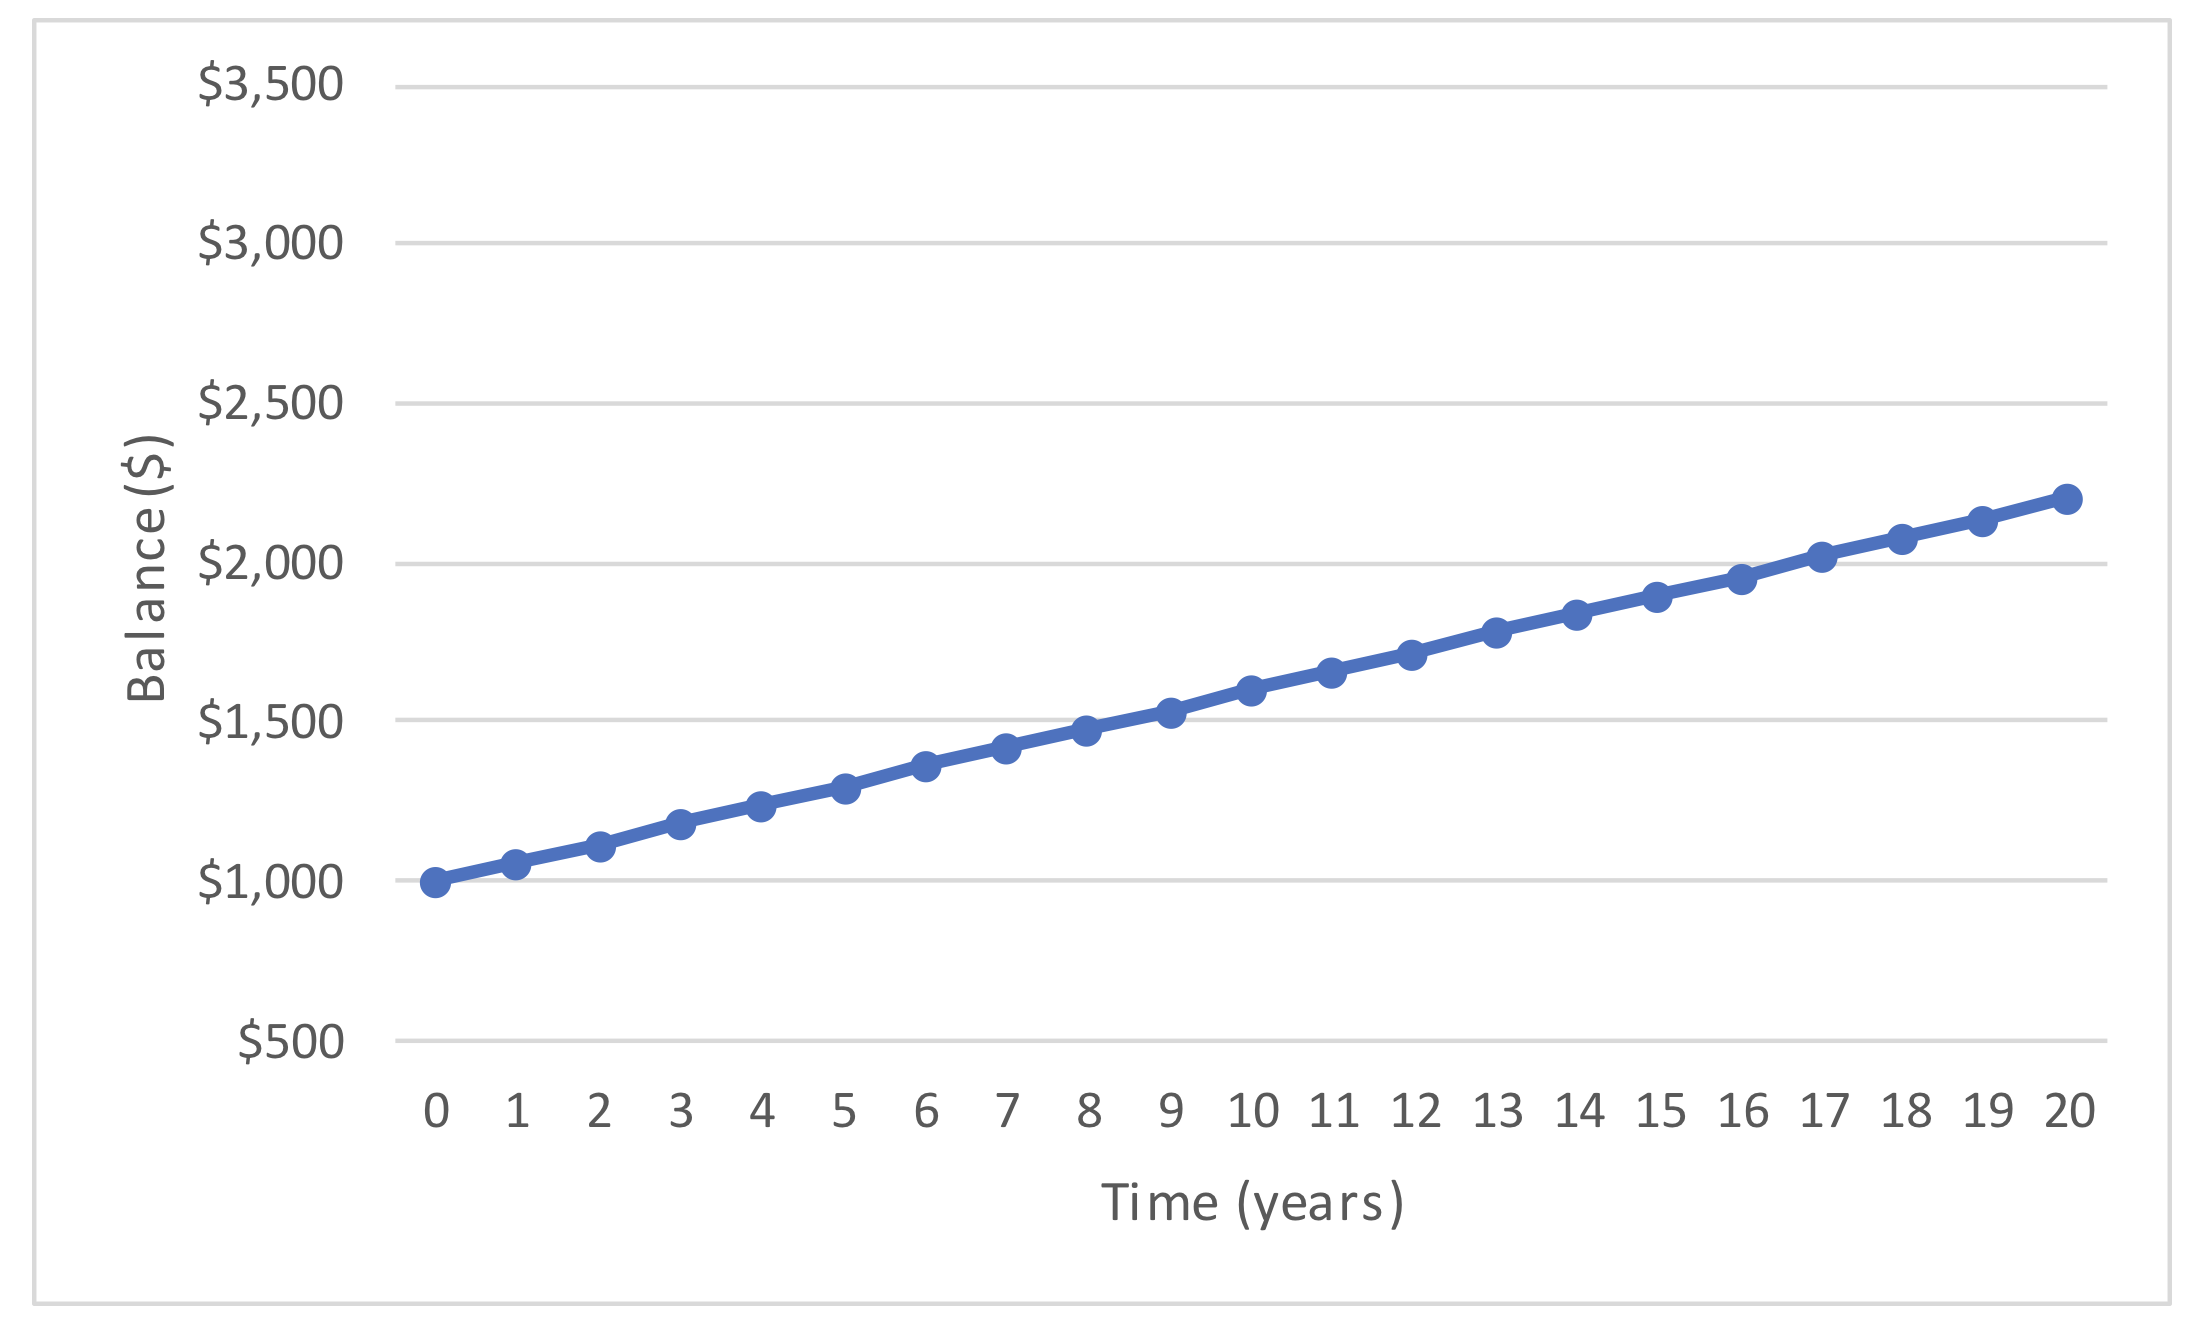
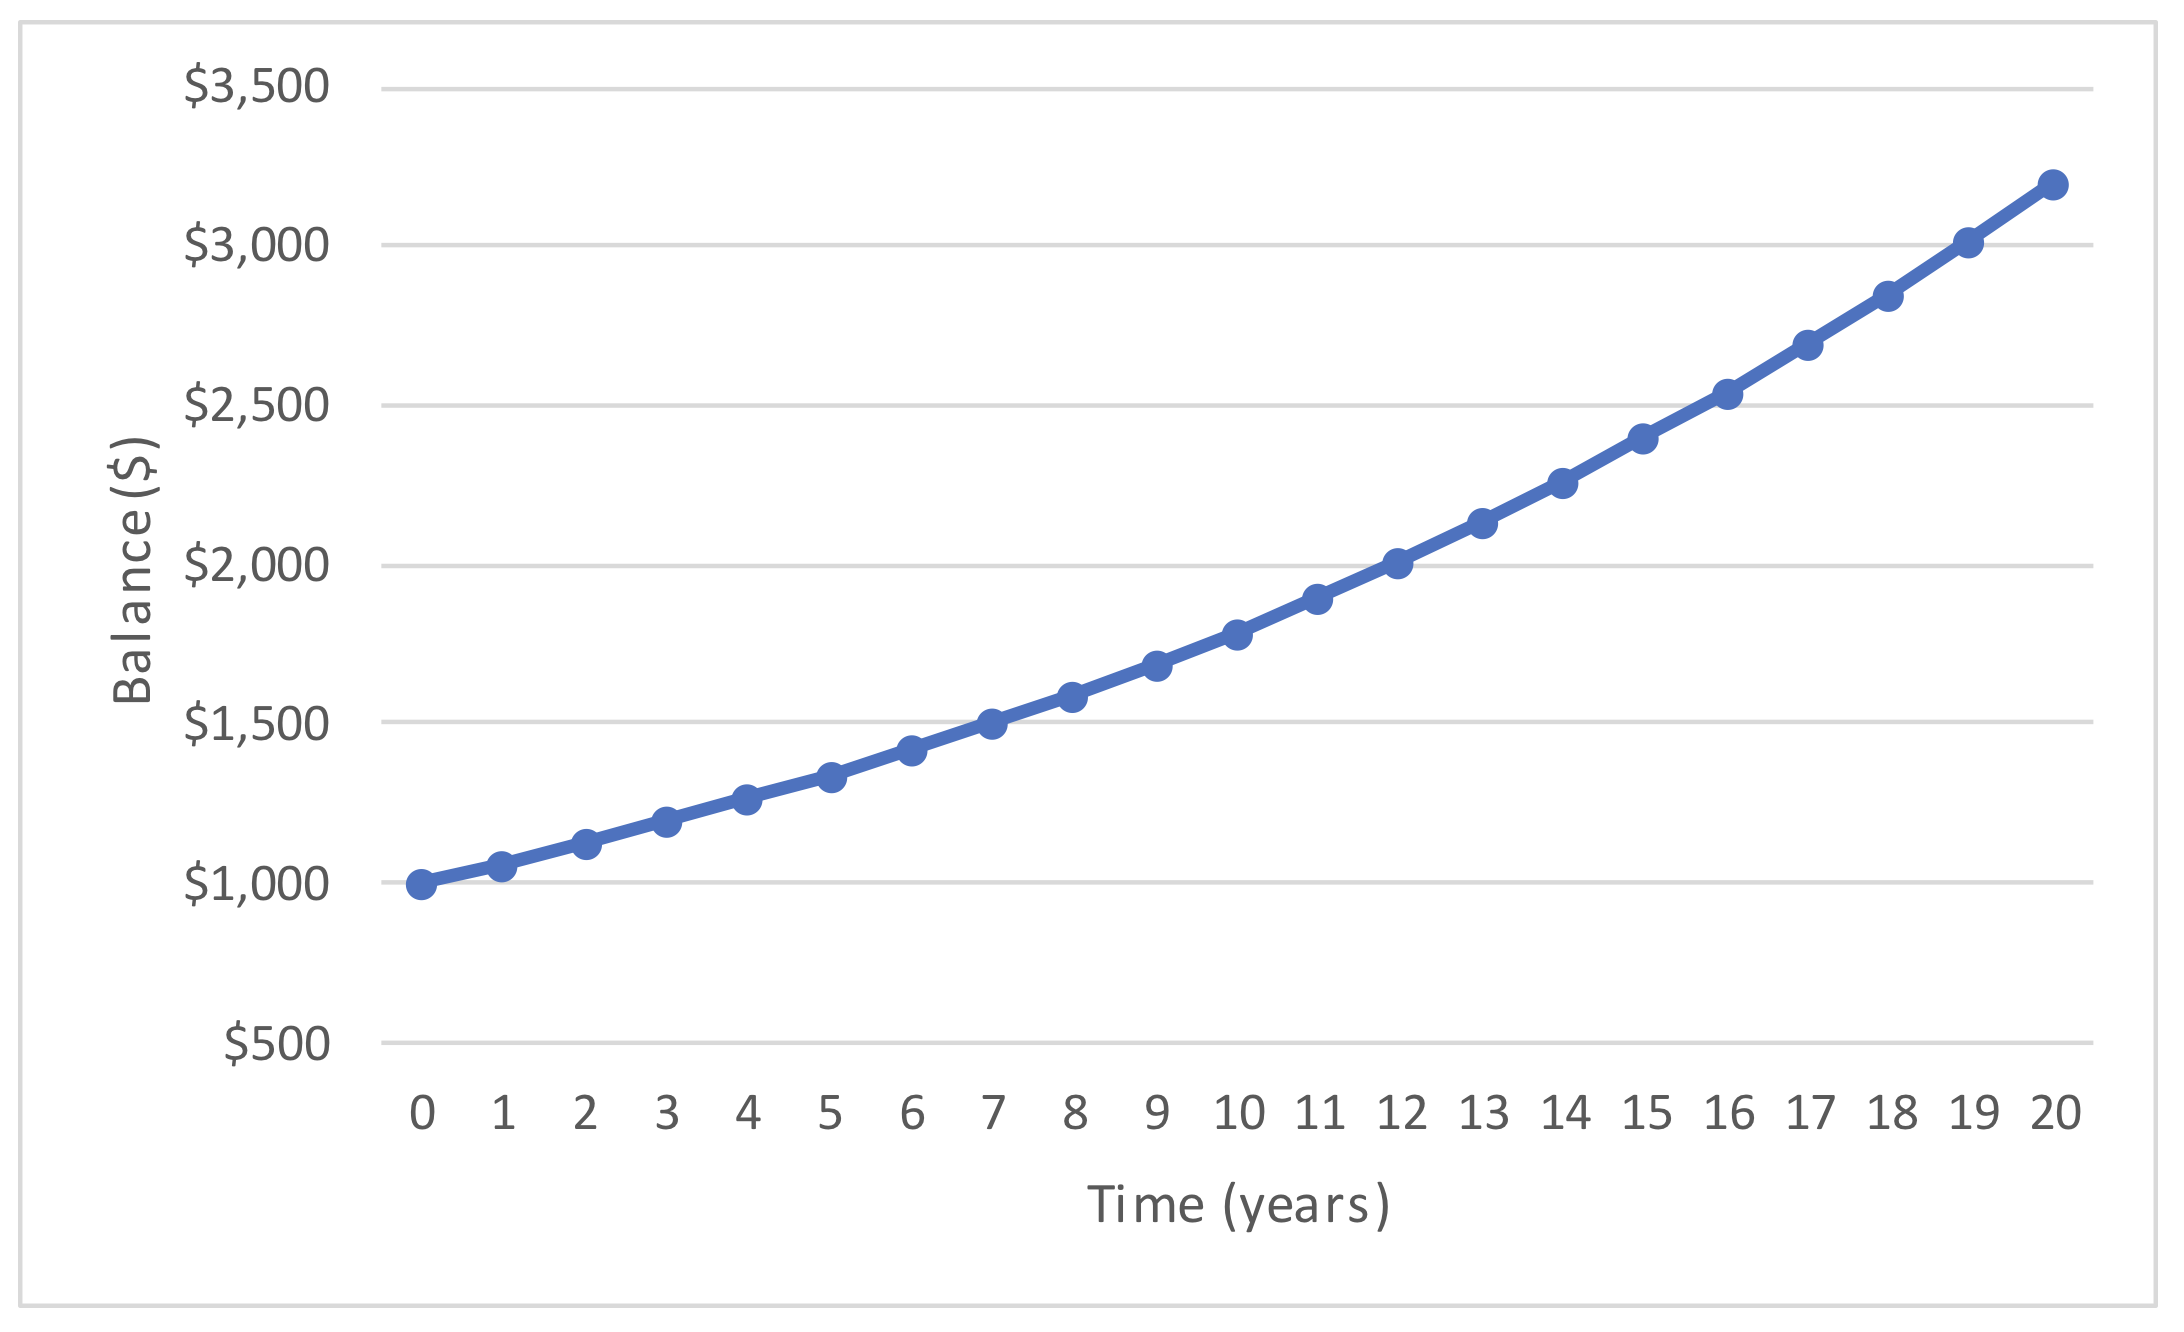
In a financial setting we know that linear growth is suitable for modelling our bank balance if a constant rate of “simple interest” is paid on our initial deposit. For example, let’s say we deposited $1,000 into a bank account and the bank credited interest at 6% per annum on the initial balance for the next 20 years. In other words, we earn interest of $60 a year, each year, for 20 years so that our final balance is $2,200. Our bank balance can be represented by the straight line below.
Bank balance: initial deposit $1,000, simple interest 6% per annum
The power of powers (and mothers)
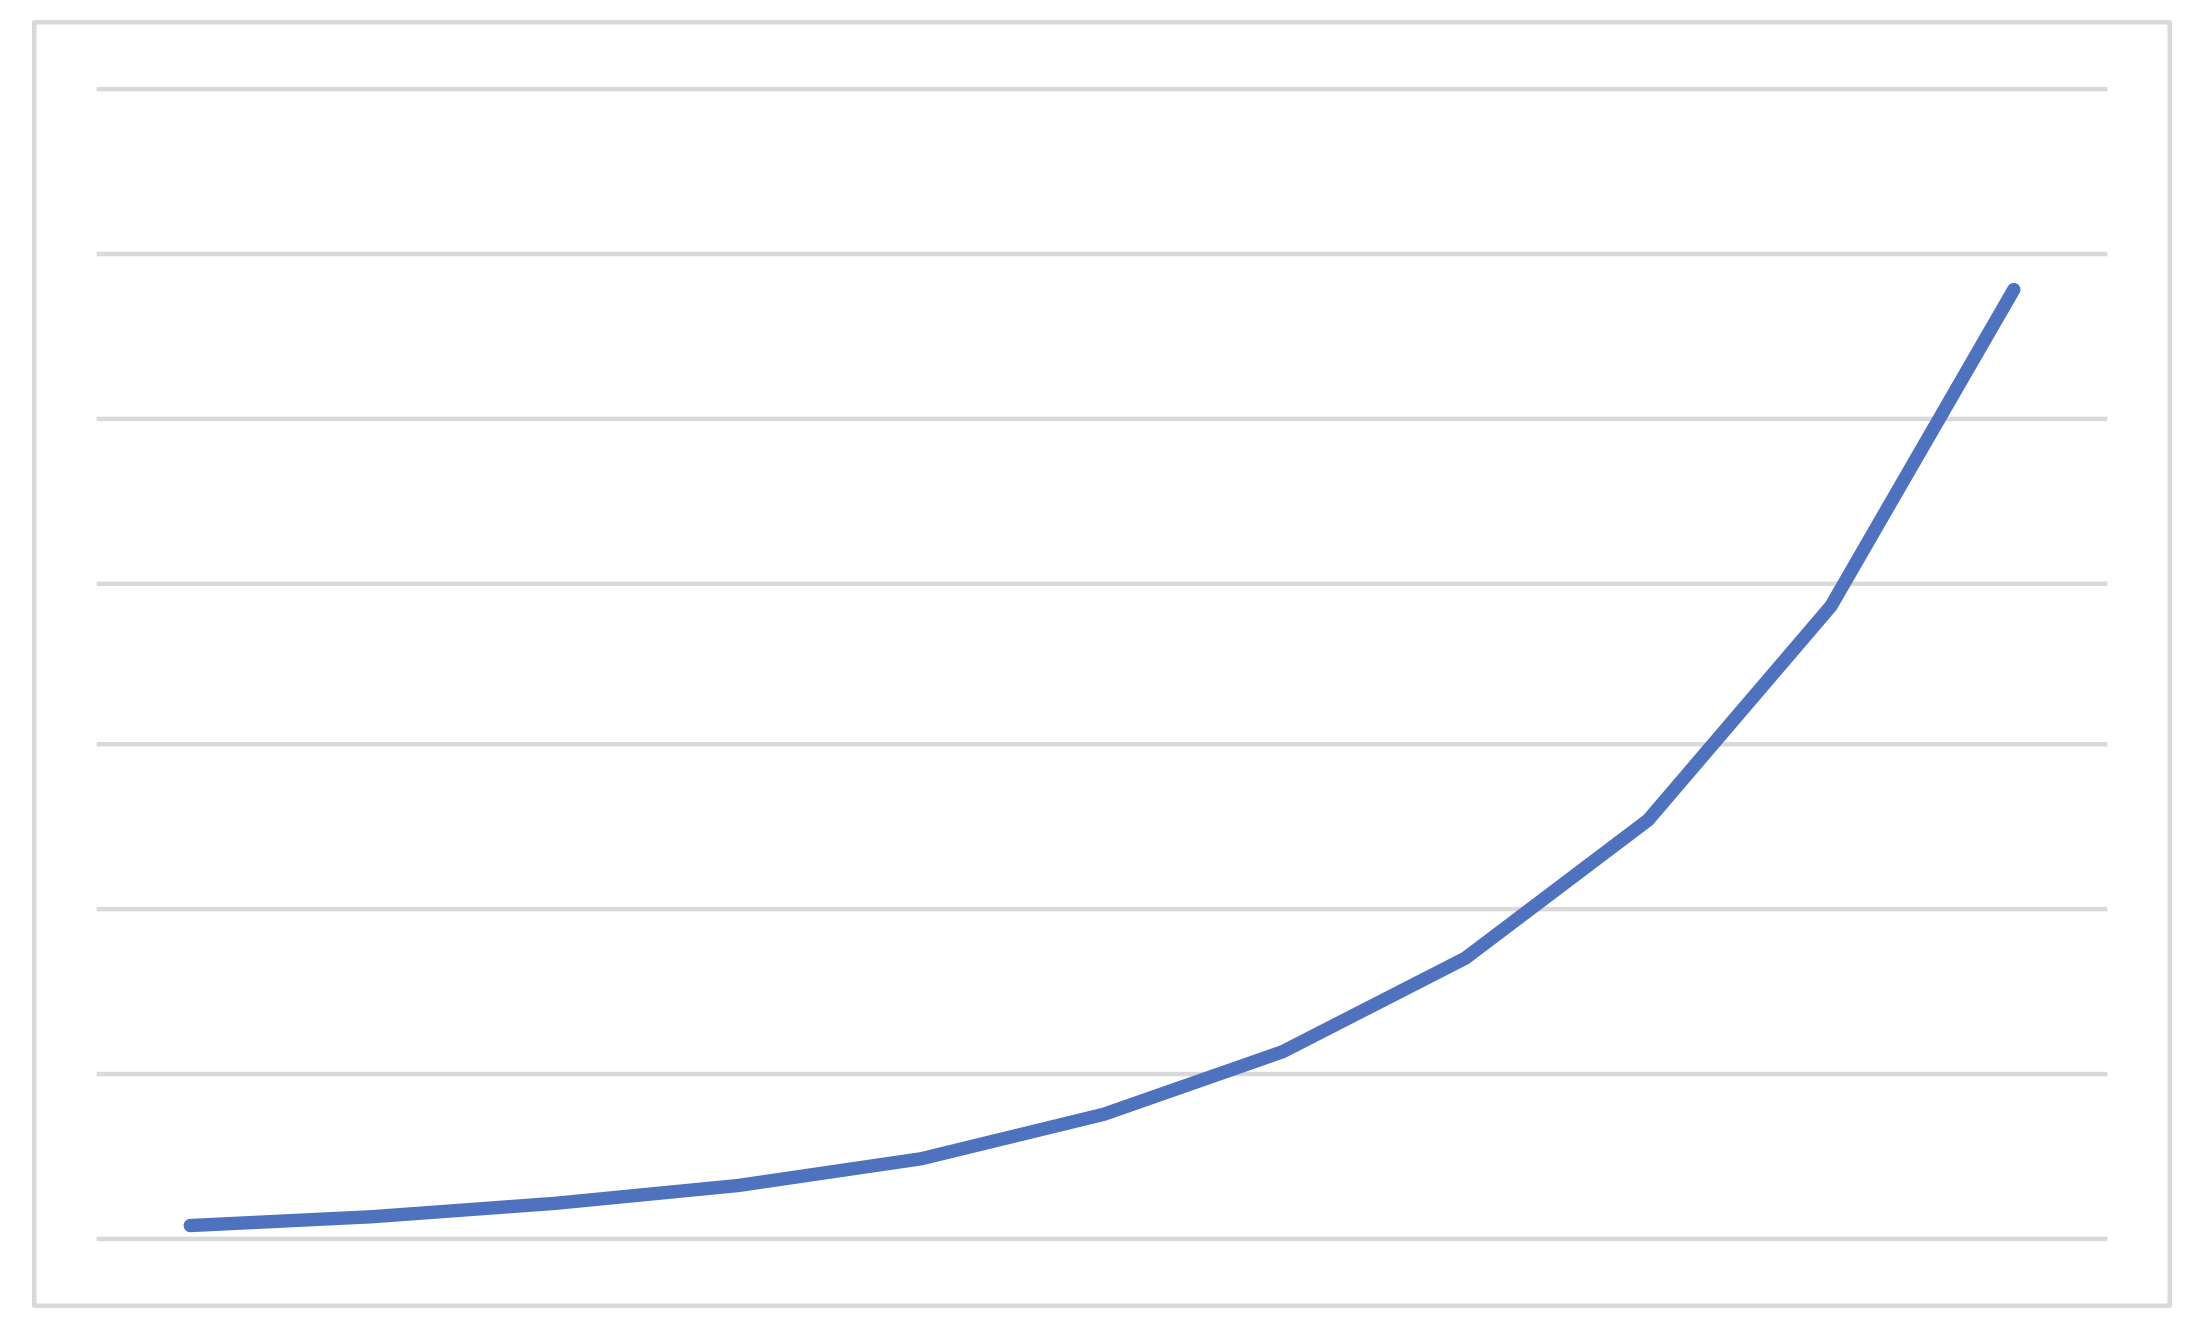
Immediately the problem we face is that banks do not pay simple interest. Rather, interest is paid on the new balance at the end of each year, or compounds. To understand how our bank balance will change over time we need a new model of growth which is exponential in nature. Distinct from a linear model, in an exponential model the growth increment does not remain constant. Rather the growth increment increases and the (percentage) rate of growth holds steady. We can visualize this as a curved line from bottom-left to top-right getting steeper and steeper.
Visualizing exponential growth
Exponential growth is more readily seen around us. Populations grow exponentially, usually at a rate of around 2% in developed countries. Look at the Australian population since the arrival of the First Fleet and you will see that it has followed an exponential growth curve, doubling every 40 years or so on average which is equivalent to a 2% average annual growth rate roughly.
Australian population since 1788 (millions)
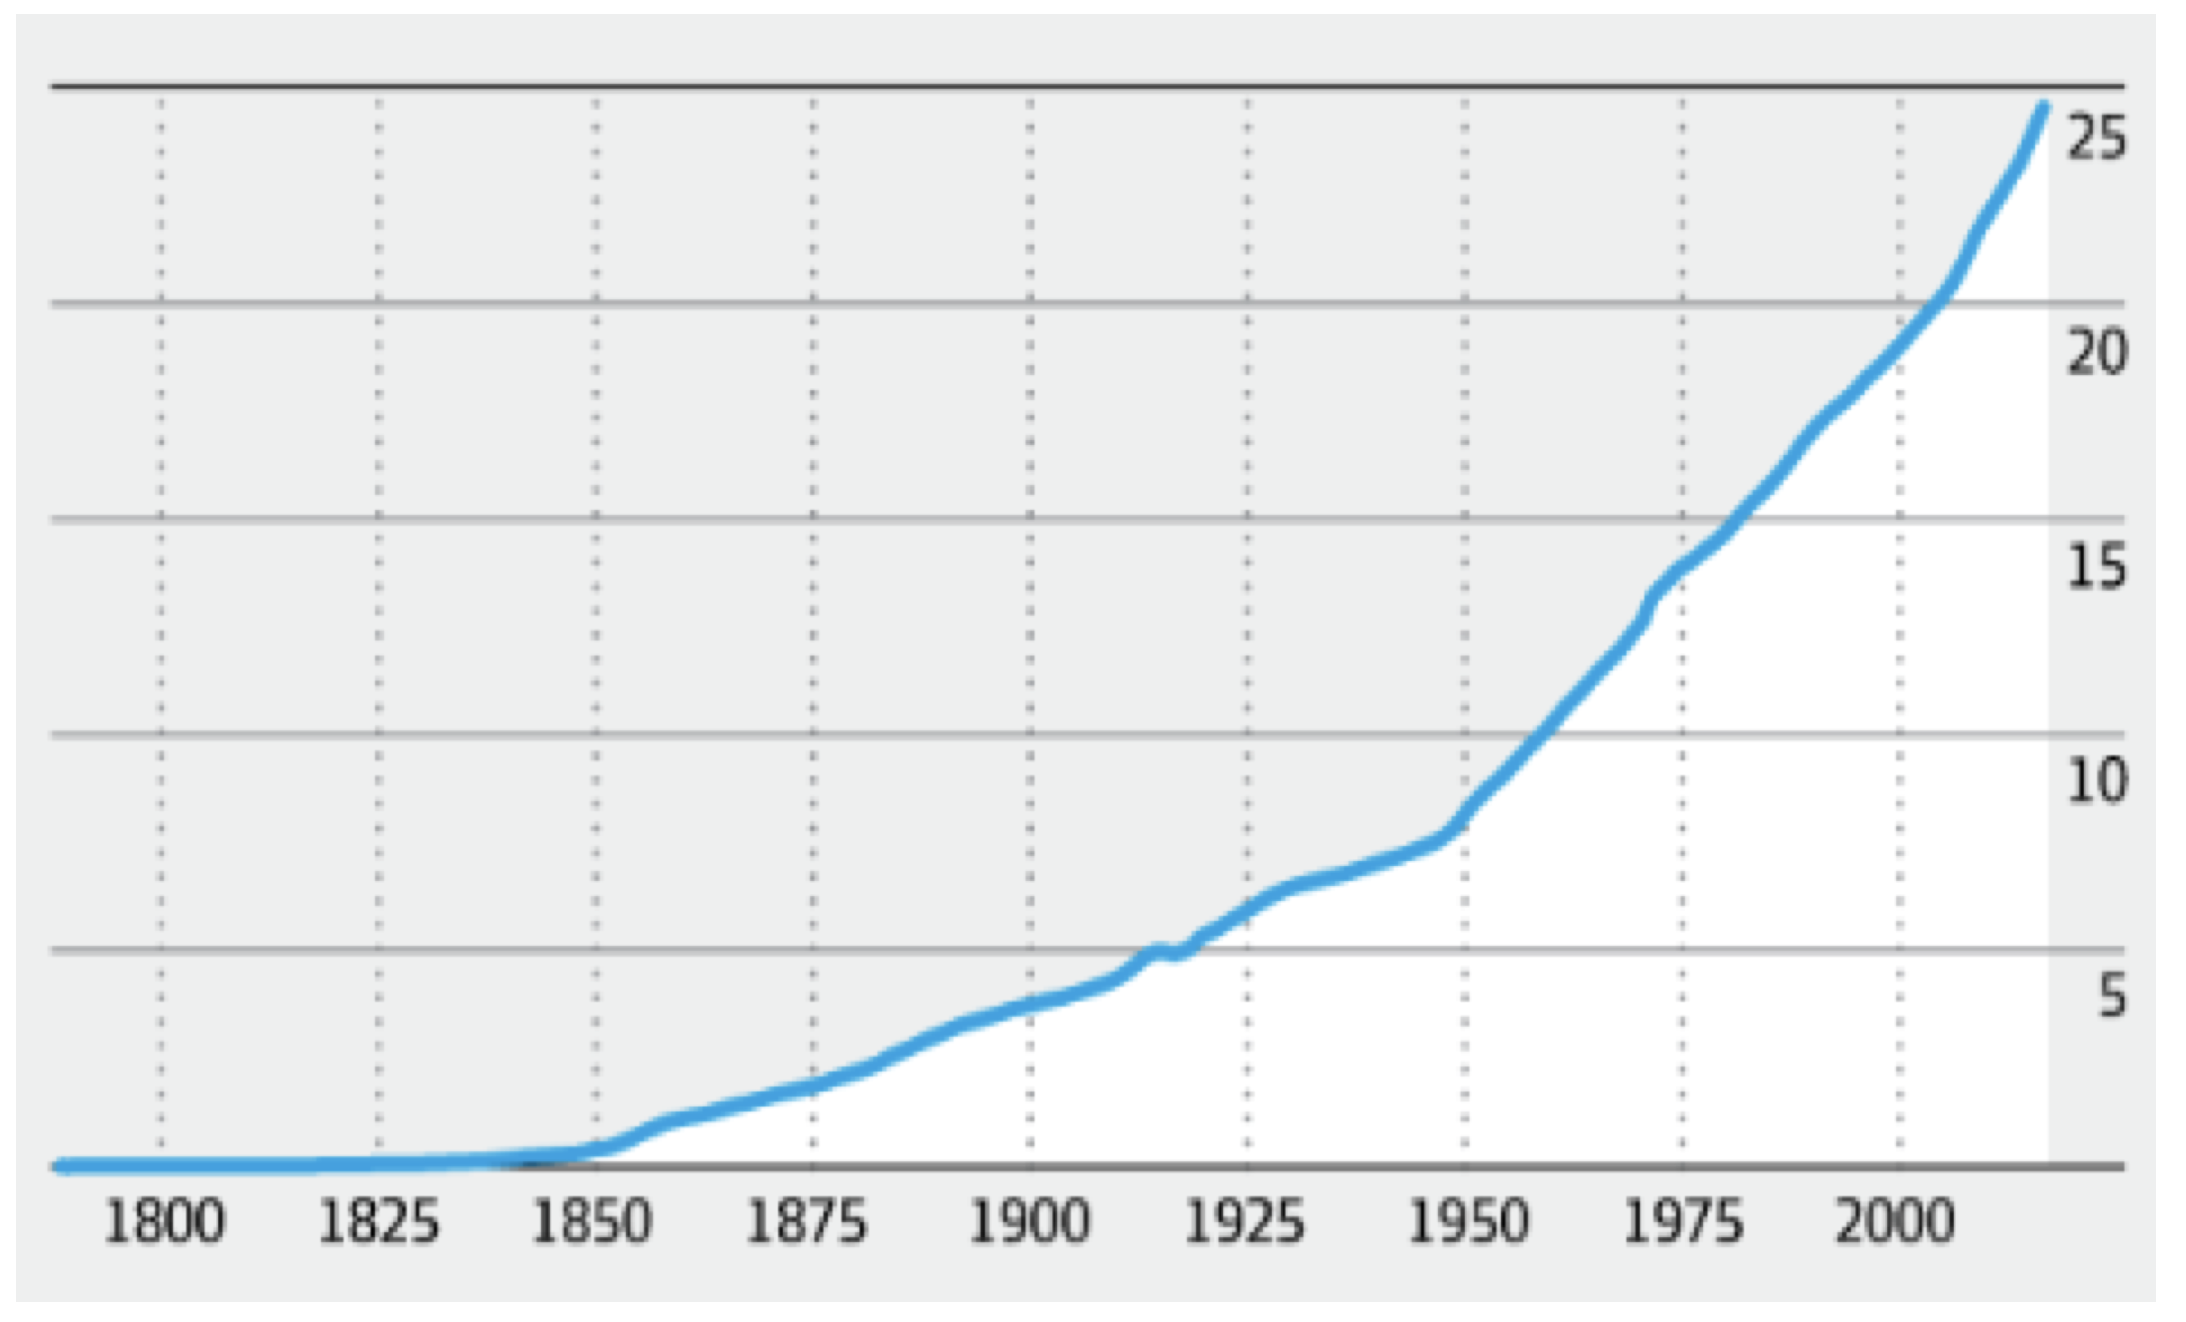
Source: ABS
Bank balances also grow exponentially when they benefit from compound interest (or the eighth wonder of the world as famed investor Warren E. Buffett describes it). Let’s tweak our prior example so that the bank pays us interest at a rate of 6% per annum on our new balance each year. That is, we earn interest on the initial sum and the interest the bank has previously credited to our account. In the first year we earn $60 just like before. But in the second year we earn about $64 – of course, the $60 on the initial sum and another $4 earned on the interest from the first year. This continues for 20 years until we have almost $1,800. You can start to see the wonders in the chart below.
Bank balance: initial deposit $1,000, compound interest 6% per annum
Exponential growth can be more difficult for our minds to deal with than linear growth, and its power can easily be missed. After Australia’s first centenary there were three million people living in the country. How many of those could have imagined that after then next hundred years there would be 15 million more Australians? Would you have guessed that by changing the interest policy from simple to compound, that our money saved at the bank in 20 years’ time would triple rather than double?
Consider for a moment the astute mother (as mothers are) who interferes with pocket-money negotiations between a boy and his father. Fed up with earning a dollar a day the boy thinks about asking for a raise but knows his father will balk. Instead the boy tells his father he will work for just one cent for the first day, doubling to two cents the next day, and then doubling again each day after. As his father quickly extends to shake the boy’s hand and agree the deal the mother jumps in: “No! you will bankrupt us!” How so? Well, sure his parents get a discount in the first week, but by the first day of the second week the boy will already be back to earning more than a dollar a day ($1.28 per day to be precise). And by mid-way through the third week the boy will have surpassed his entire previous annual allowance. The power of exponential growth…and mothers.
S-curves
Unfortunately, while exponential growth curves are very good models for populations and compound interest over time, they have significant shortcomings in the natural world. For instance, exponential growth can be experienced for a period, but not forever – otherwise we would be seeing a lot of things expanding to infinity and increasing infinitely from there. (In a month our young boy would become a millionaire; a billionaire a couple weeks later; the richest man on the planet a week after that; and well on his way to becoming an “infinillionaire”!)
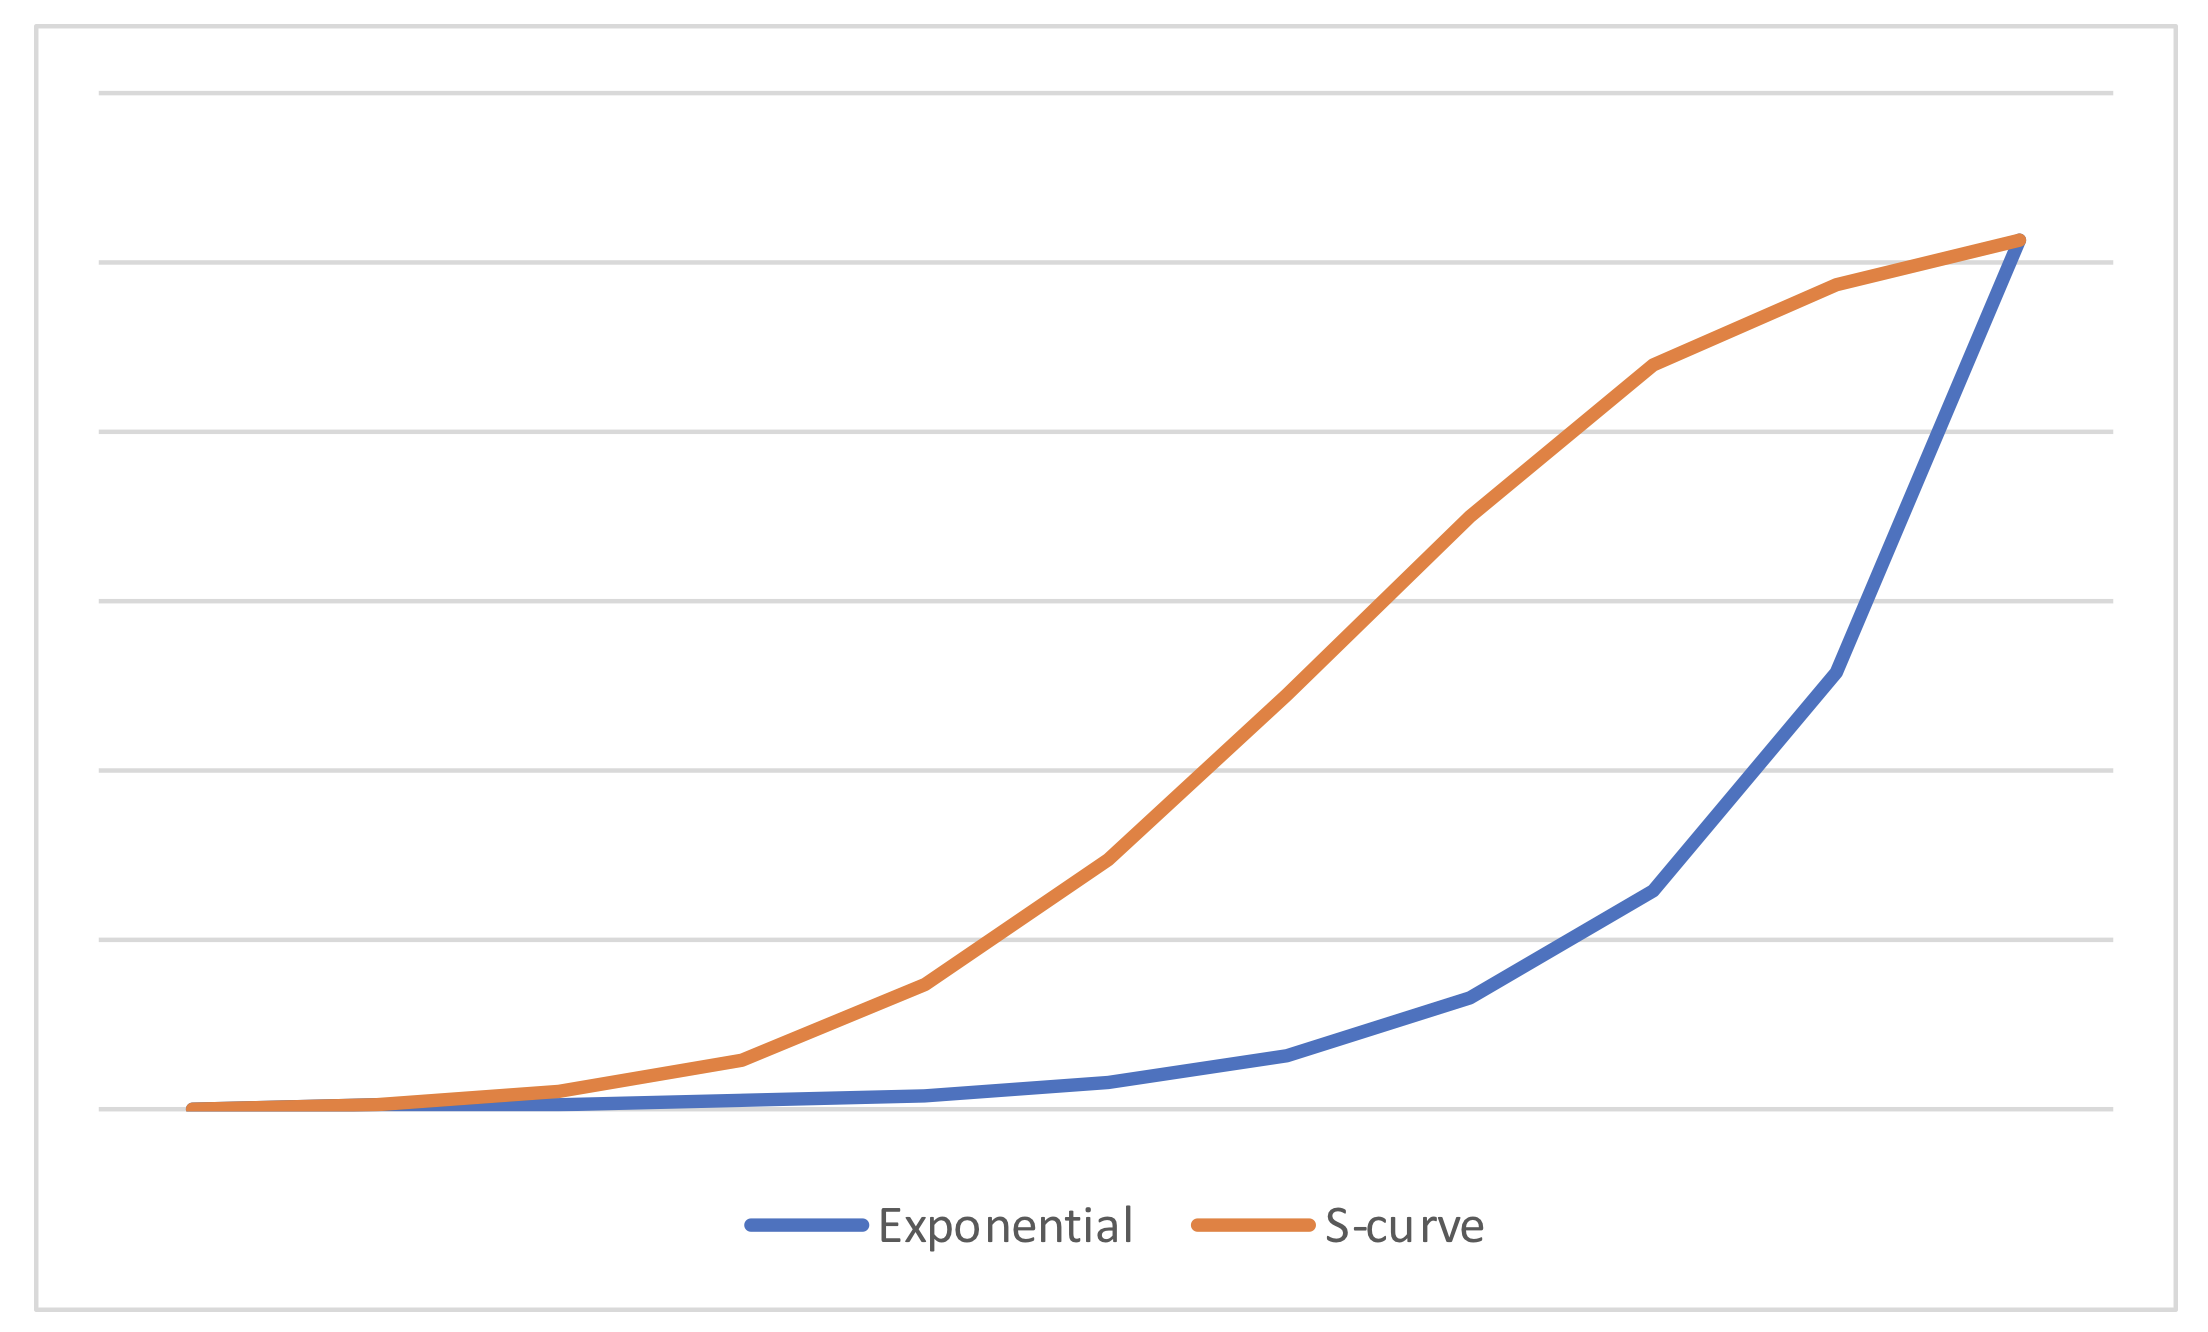
When it comes to understanding growth in an industry or company that has structural tailwinds, exponential models present us with the opposite problem – they don’t grow quick enough initially. Disruptive changes in the world, like the ones that come with technological innovation, grow rapidly once they reach some take off point, then growth moderates in maturity. We can visualize the difference between growth described by the exponential model and the disruptive “S-curve” below.
Visualizing disruptive (“S-curve”) vs exponential growth
Numerous examples of S-curve growth can be found in the uptake of different technologies over time. This is illustrated in the chart below.
Penetration of US households
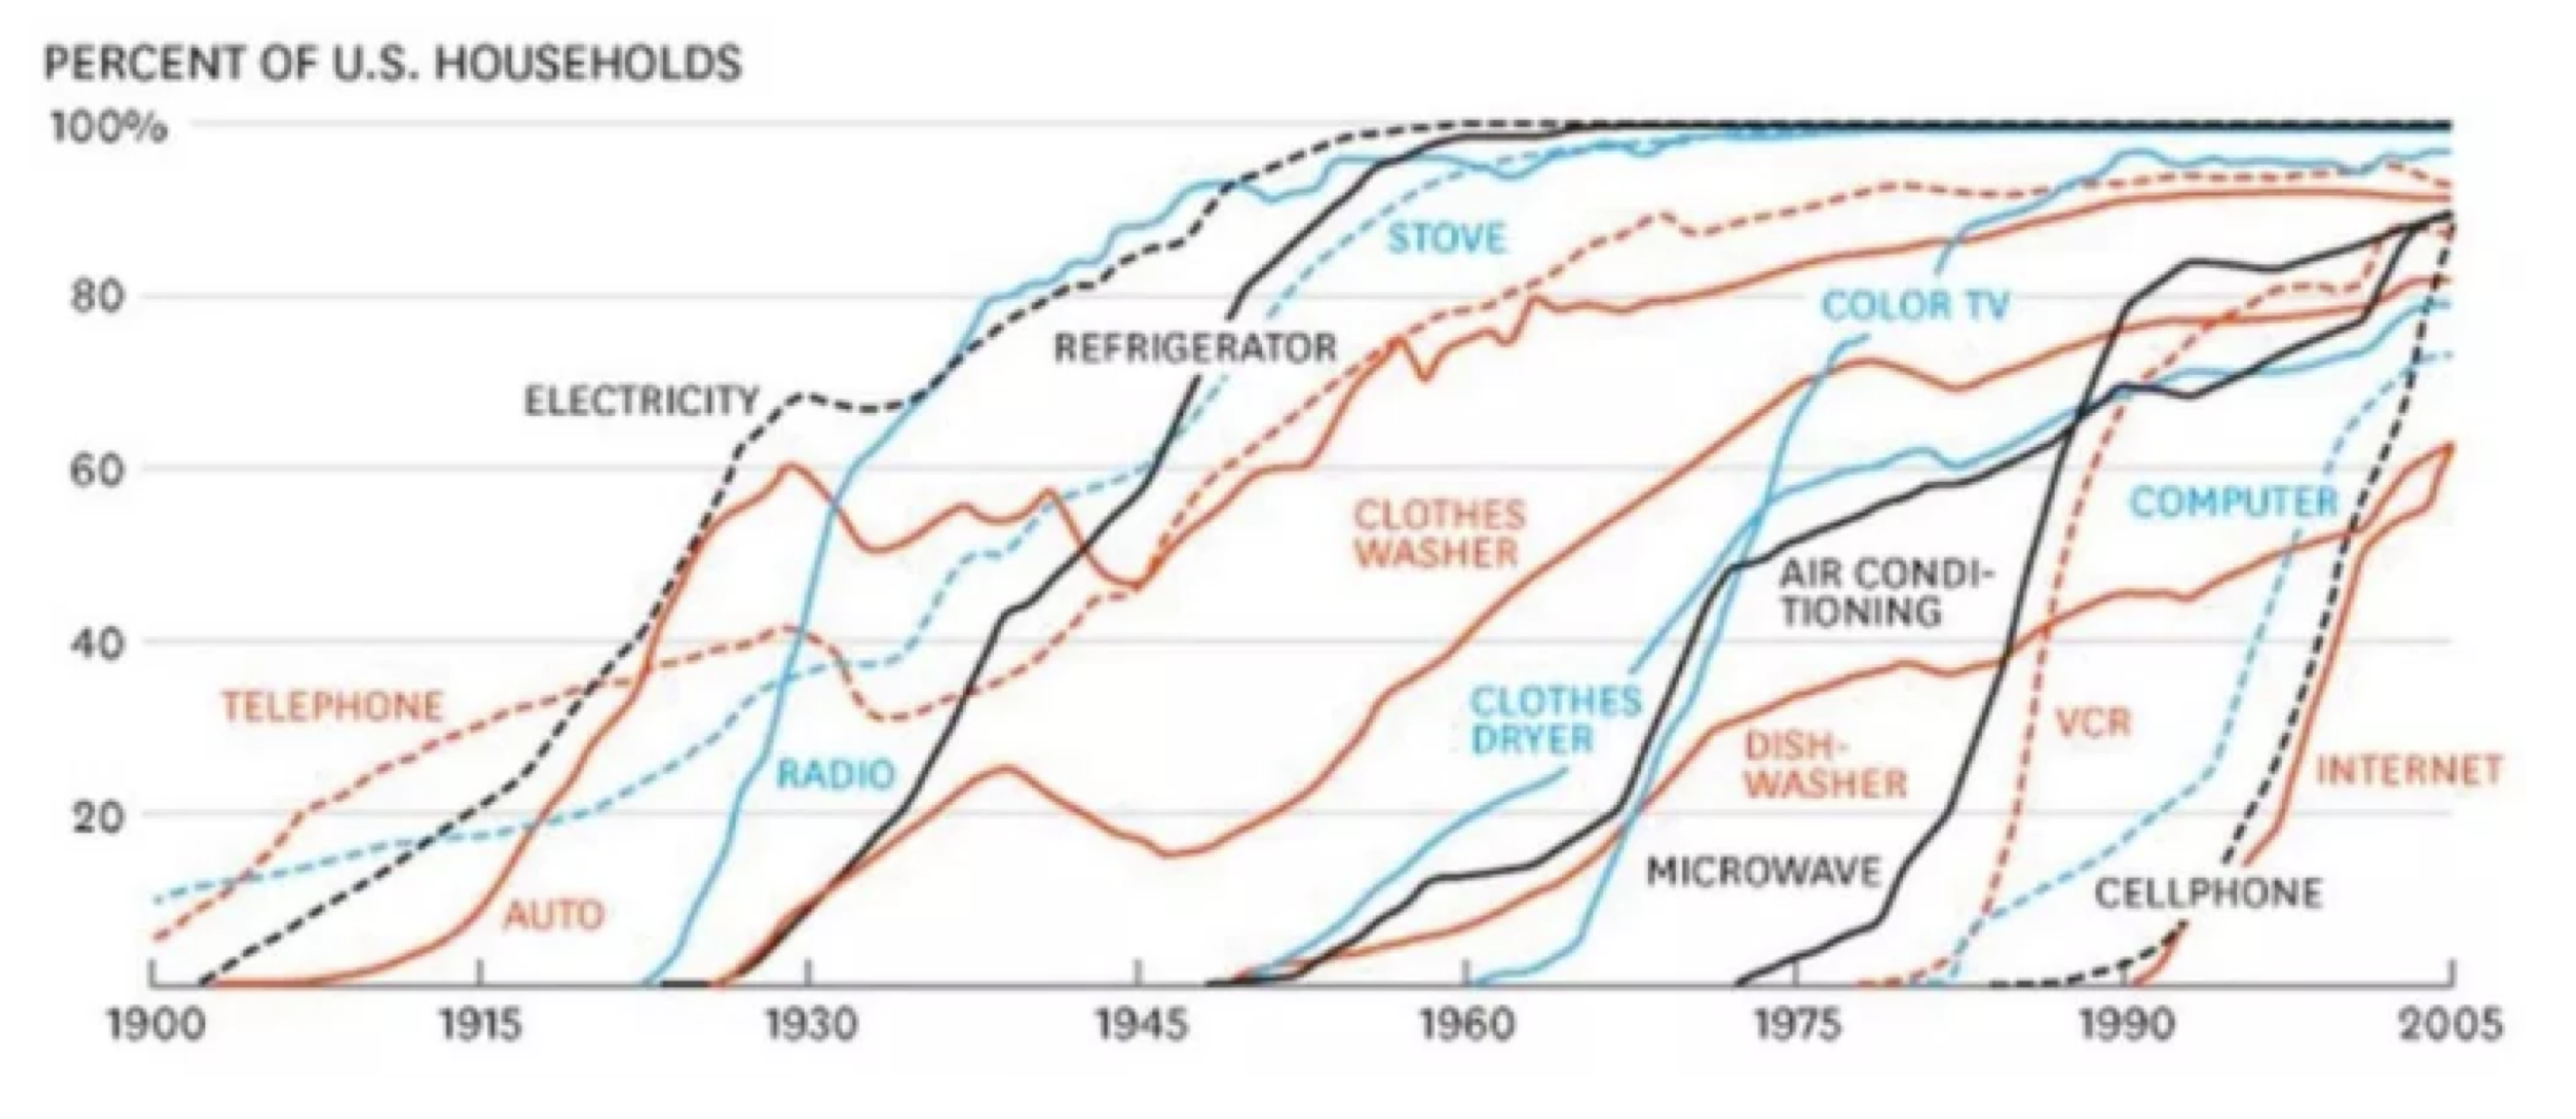
Source: The New York Times
We are seeing S-curve style explosive growth play out in the Montaka funds’ investee companies. Alphabet is the owner of Google which is experiencing 20% per annum growth in its core online advertising business, driven by digital disruption of marketing dollars which are quickly flowing to the Internet. This trend has reaccelerated with the proliferation of mobile devices.
US Internet advertising spend

Source: Kleiner Perkins
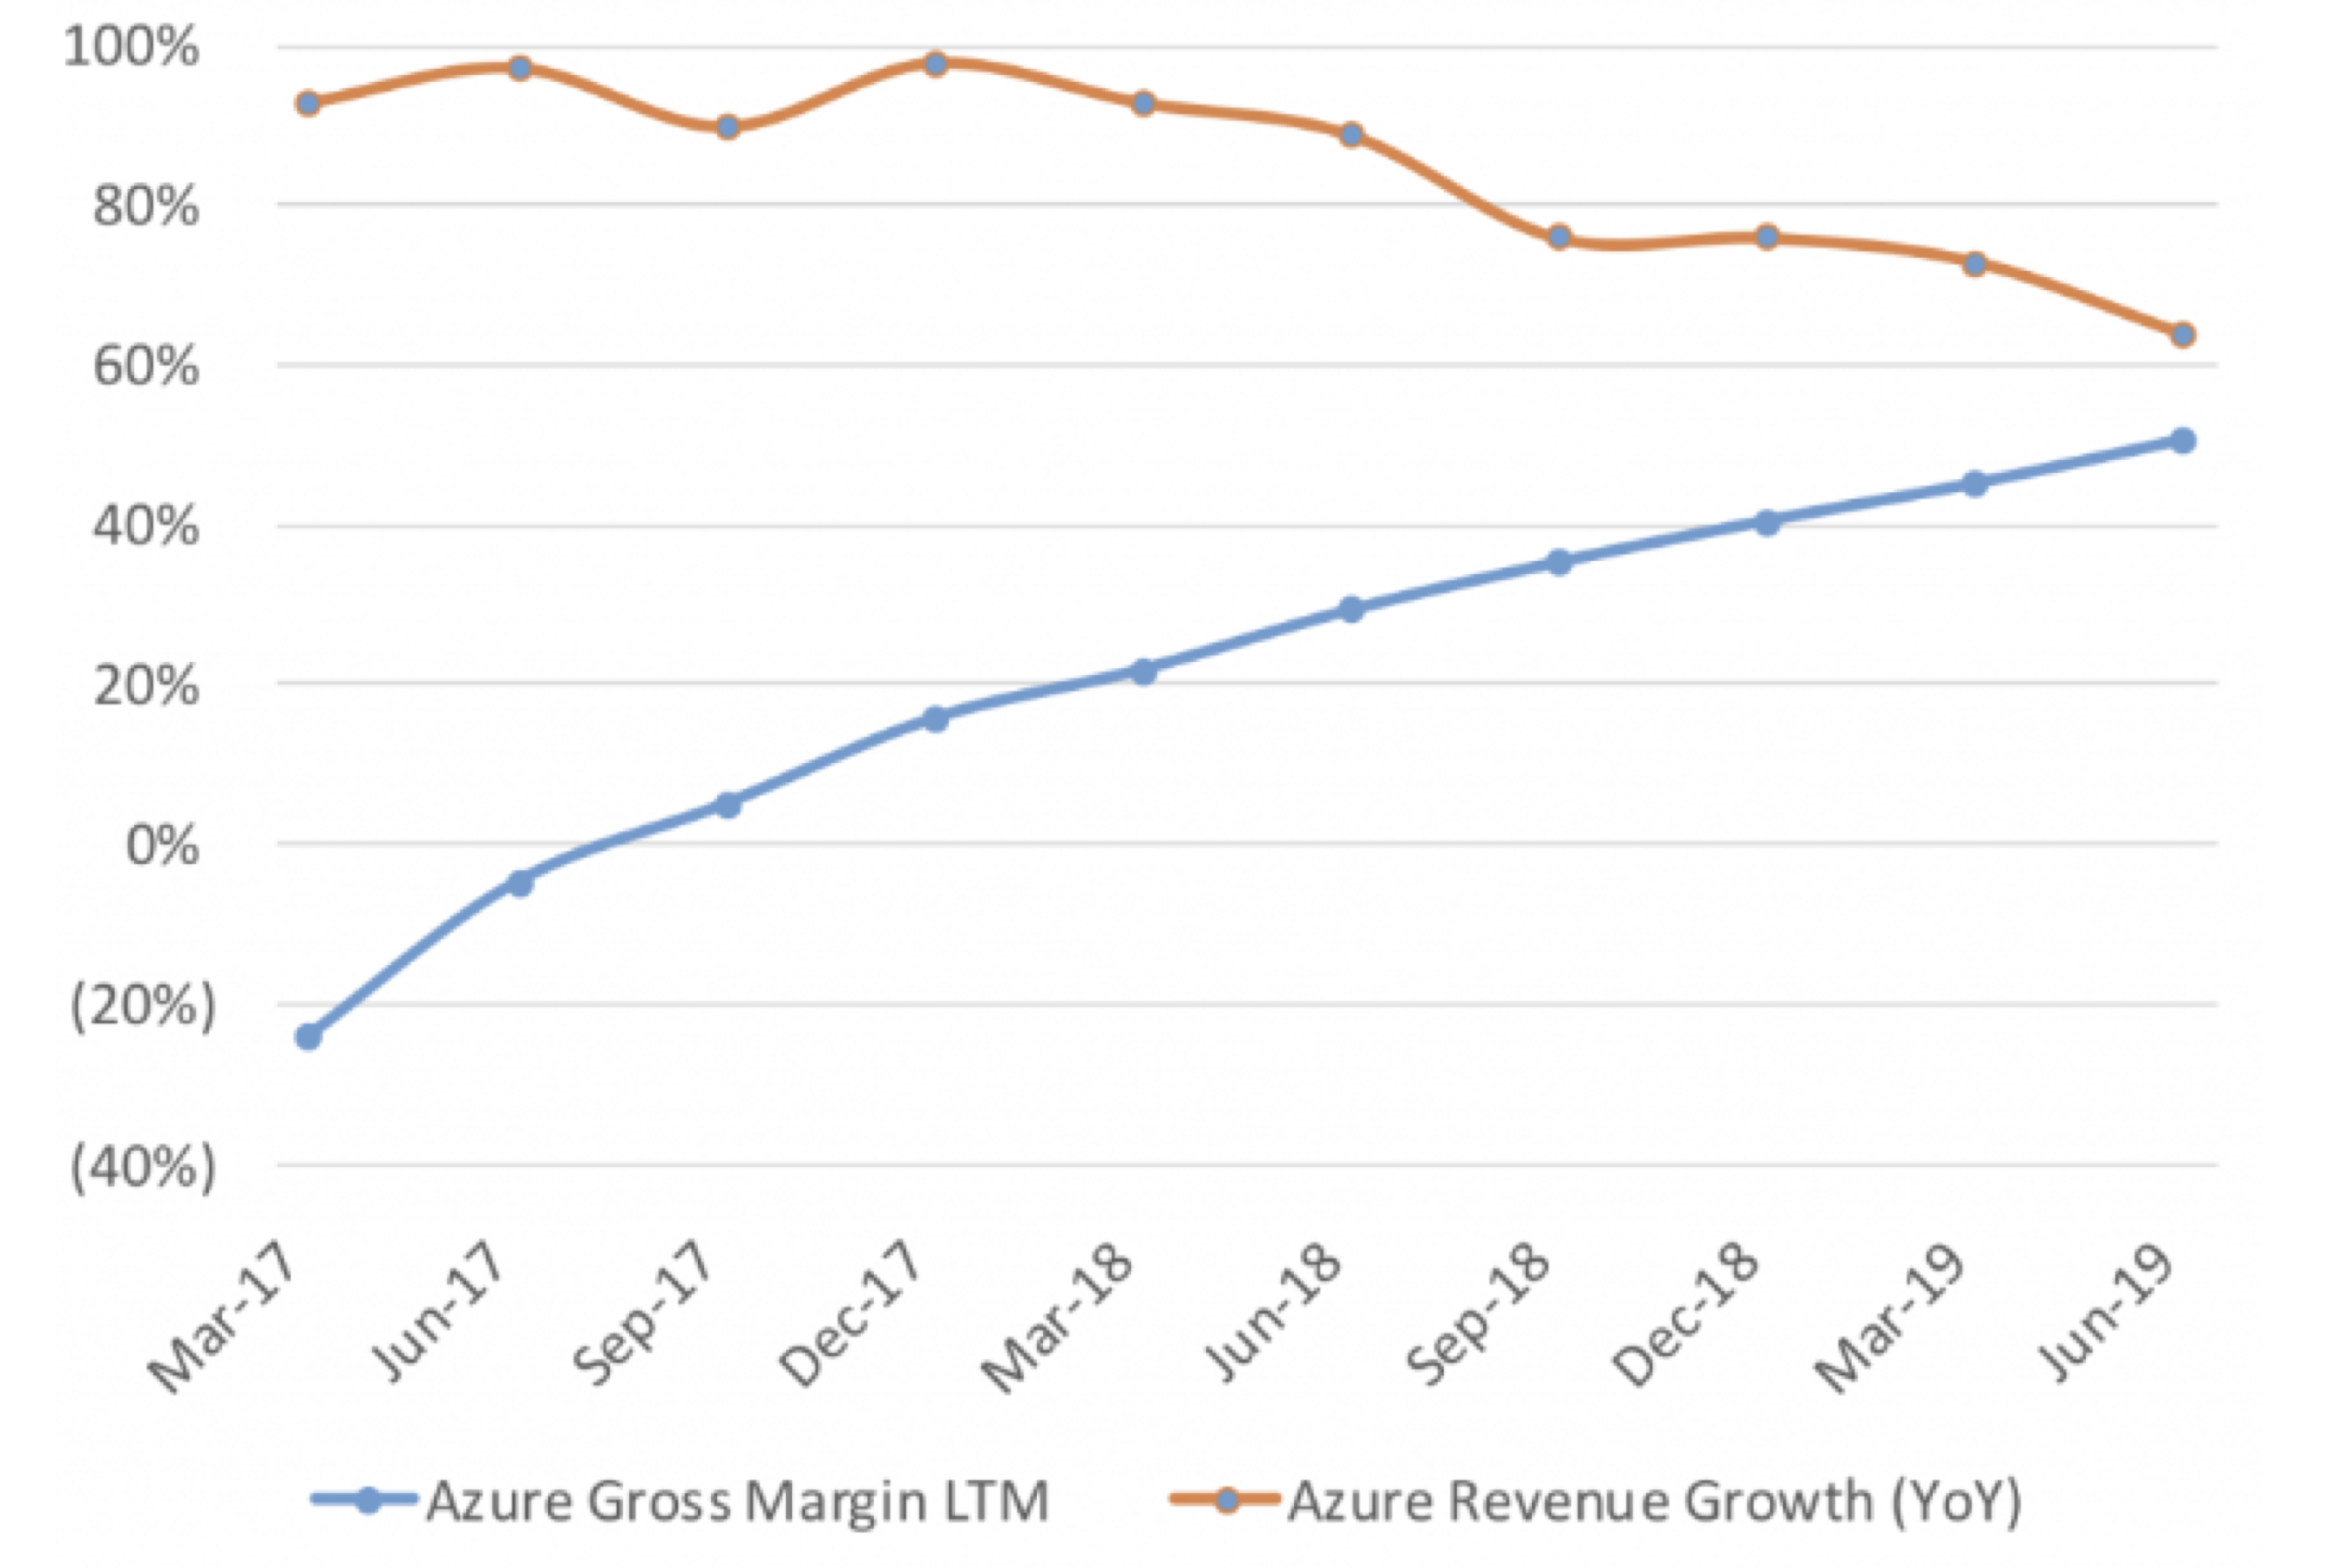
Explosive growth is also being experienced by Microsoft’s cloud business, Azure. As enterprises migrate their technology systems from on-site data centres to off-premise “cloud” services, Azure’s revenue has maintained annual growth rates from 60% to 100% over the past two years and the trend is expected to continue even as profitability rises.
Understanding different growth models, applying the correct model, and identifying companies that are benefitting from being in the sweet-spot of an industry S-curve is imperative when it comes to identifying great businesses that will grow meaningfully for a long time to come. You should not be surprised to see many of these sorts of companies in the Montaka long portfolio.
![]()
Christopher Demasi is a Portfolio Manager with Montaka Global Investments.
To learn more about Montaka, please call +612 7202 0100.