|
Getting your Trinity Audio player ready...
|
We know many of our investors are faced with the challenge of constructing portfolios. Typically, we are not the only strategy owned by our investors, so the challenge becomes one of optimising an overall portfolio of a number of different strategies.
We have spent some time thinking about the challenge of portfolio construction. And we have devised a simple framework that could be helpful to those who are facing this challenge.
First, we need a set of criteria for what we believe really matters in the world of investing today. Shown below, we believe investors should evaluate equity managers across three key dimensions:
- Alpha generation – this is the demonstrated ability for the manager to add value over and above the equity market index on a sustained basis. And to the extent we are heading into a lower-returning environment more generally, then alpha will become a larger share of the total return – and therefore, relatively more important – going forward;
- Downside protection – this is the ability for the manager to help preserve capital during a market downturn. As the current bull market is one of the longest on record, the value of downside protection today is arguably high; and
- Low correlation – this is the ability for the manager’s return profile to blend well with other strategies in the portfolio, thereby reducing overall portfolio risk. We have written about the “hidden value” of low correlation before.
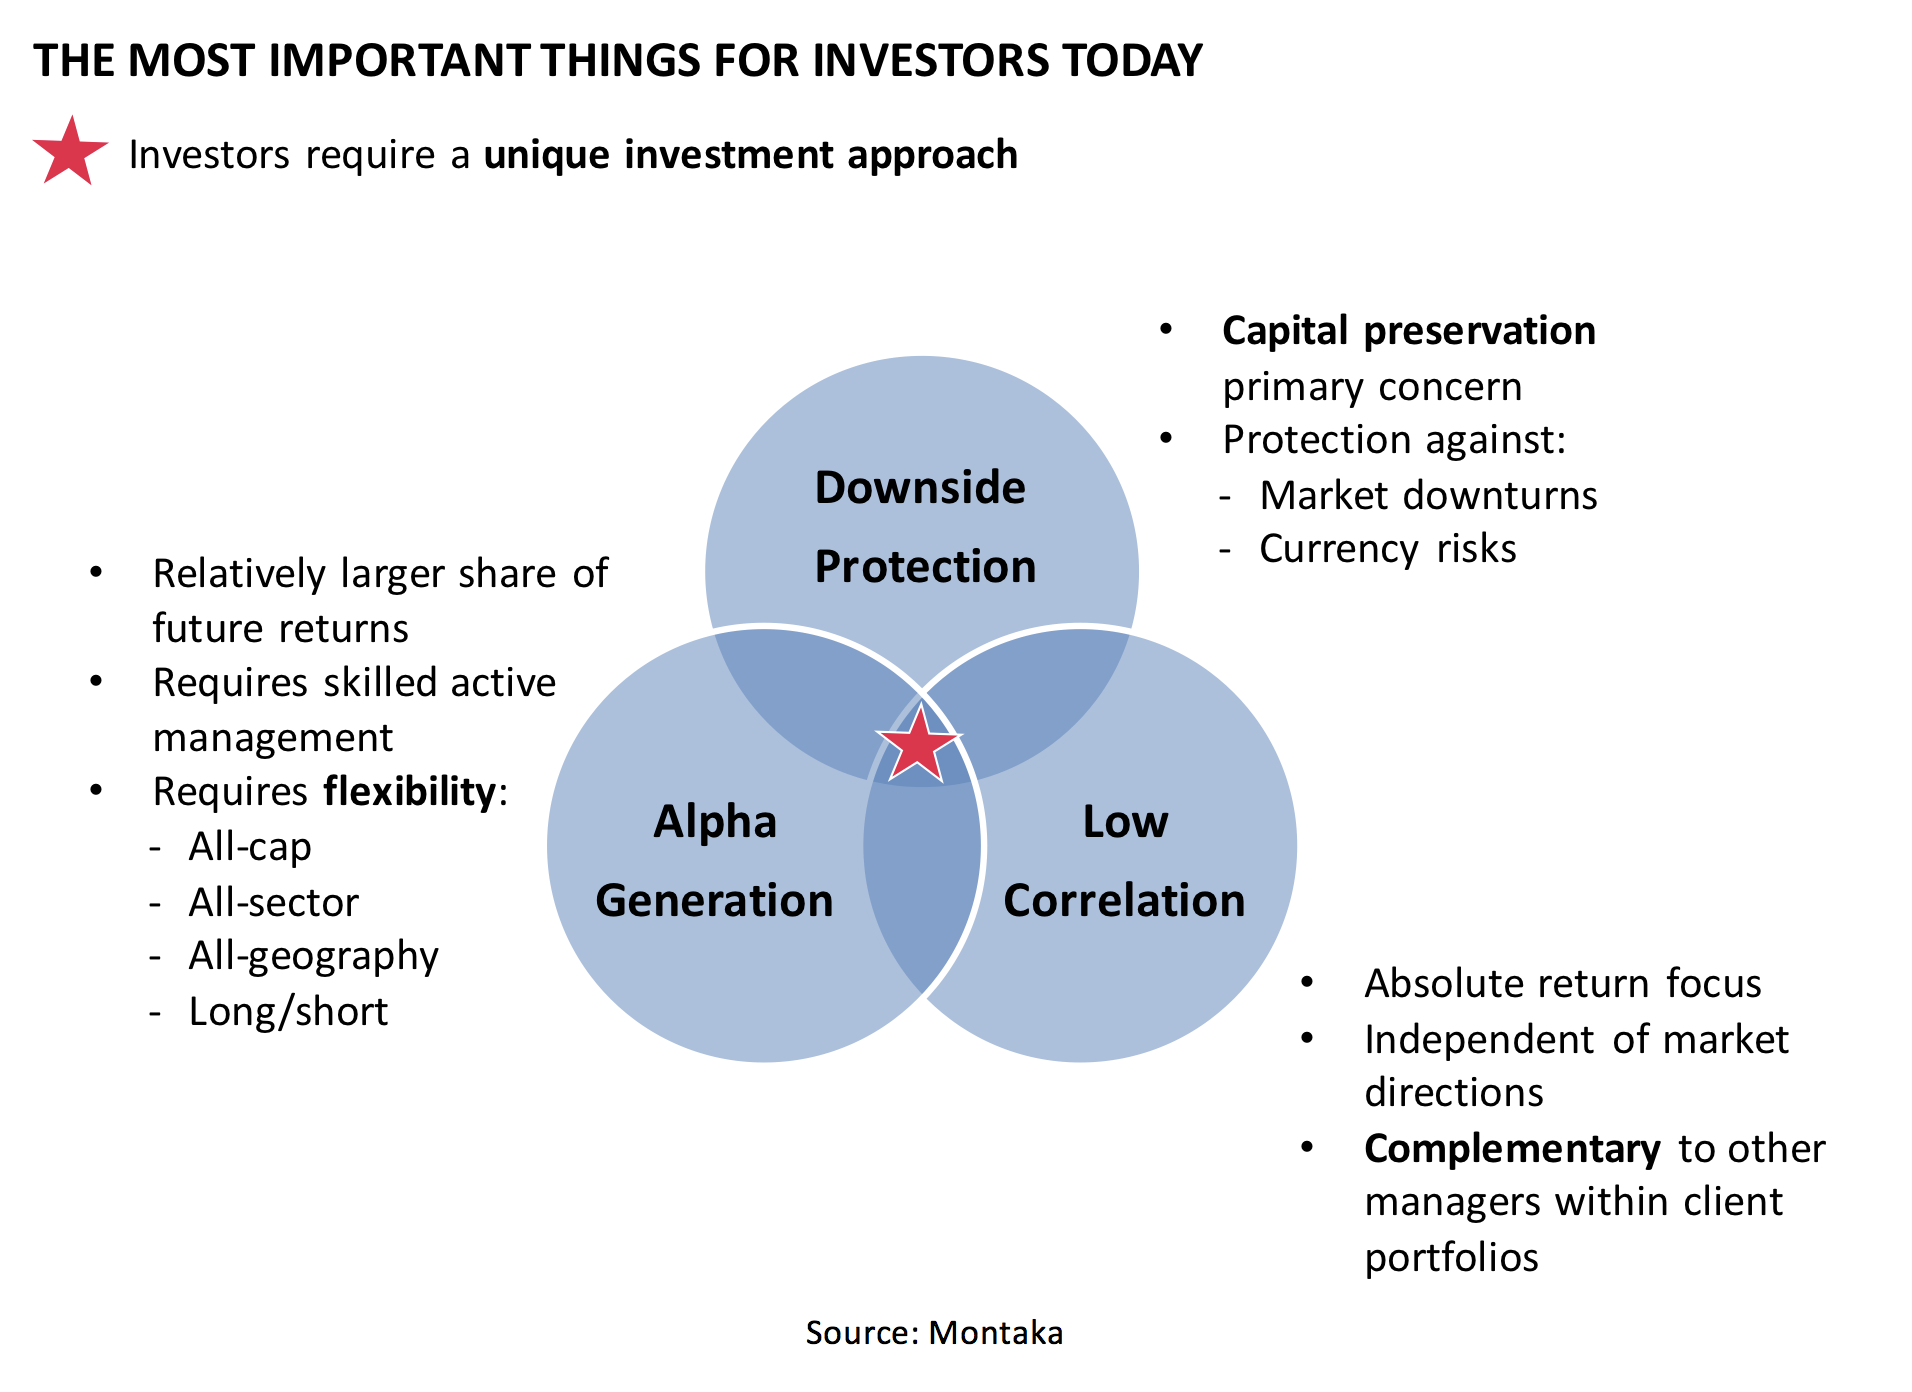
Given the above criteria, we have devised a simple framework that investors may find helpful in their quest to evaluate different managers along the above dimensions:
- On the vertical axis of the matrix below, we map the manager’s risk-adjusted returns. The combination of strong alpha-generation and downside protection will result in high risk-adjusted returns. We believe the best measure of risk-adjusted returns is the Sharpe Ratio of the US dollar-equivalent returns of any global manager[1]. We define the Sharpe Ratio as the ratio of the annualised excess return above the US 10YR government; to the annualised volatility of the return profile.
- On the horizontal axis of the matrix below, we map the correlation of the manager’s return to the returns of the global market index.
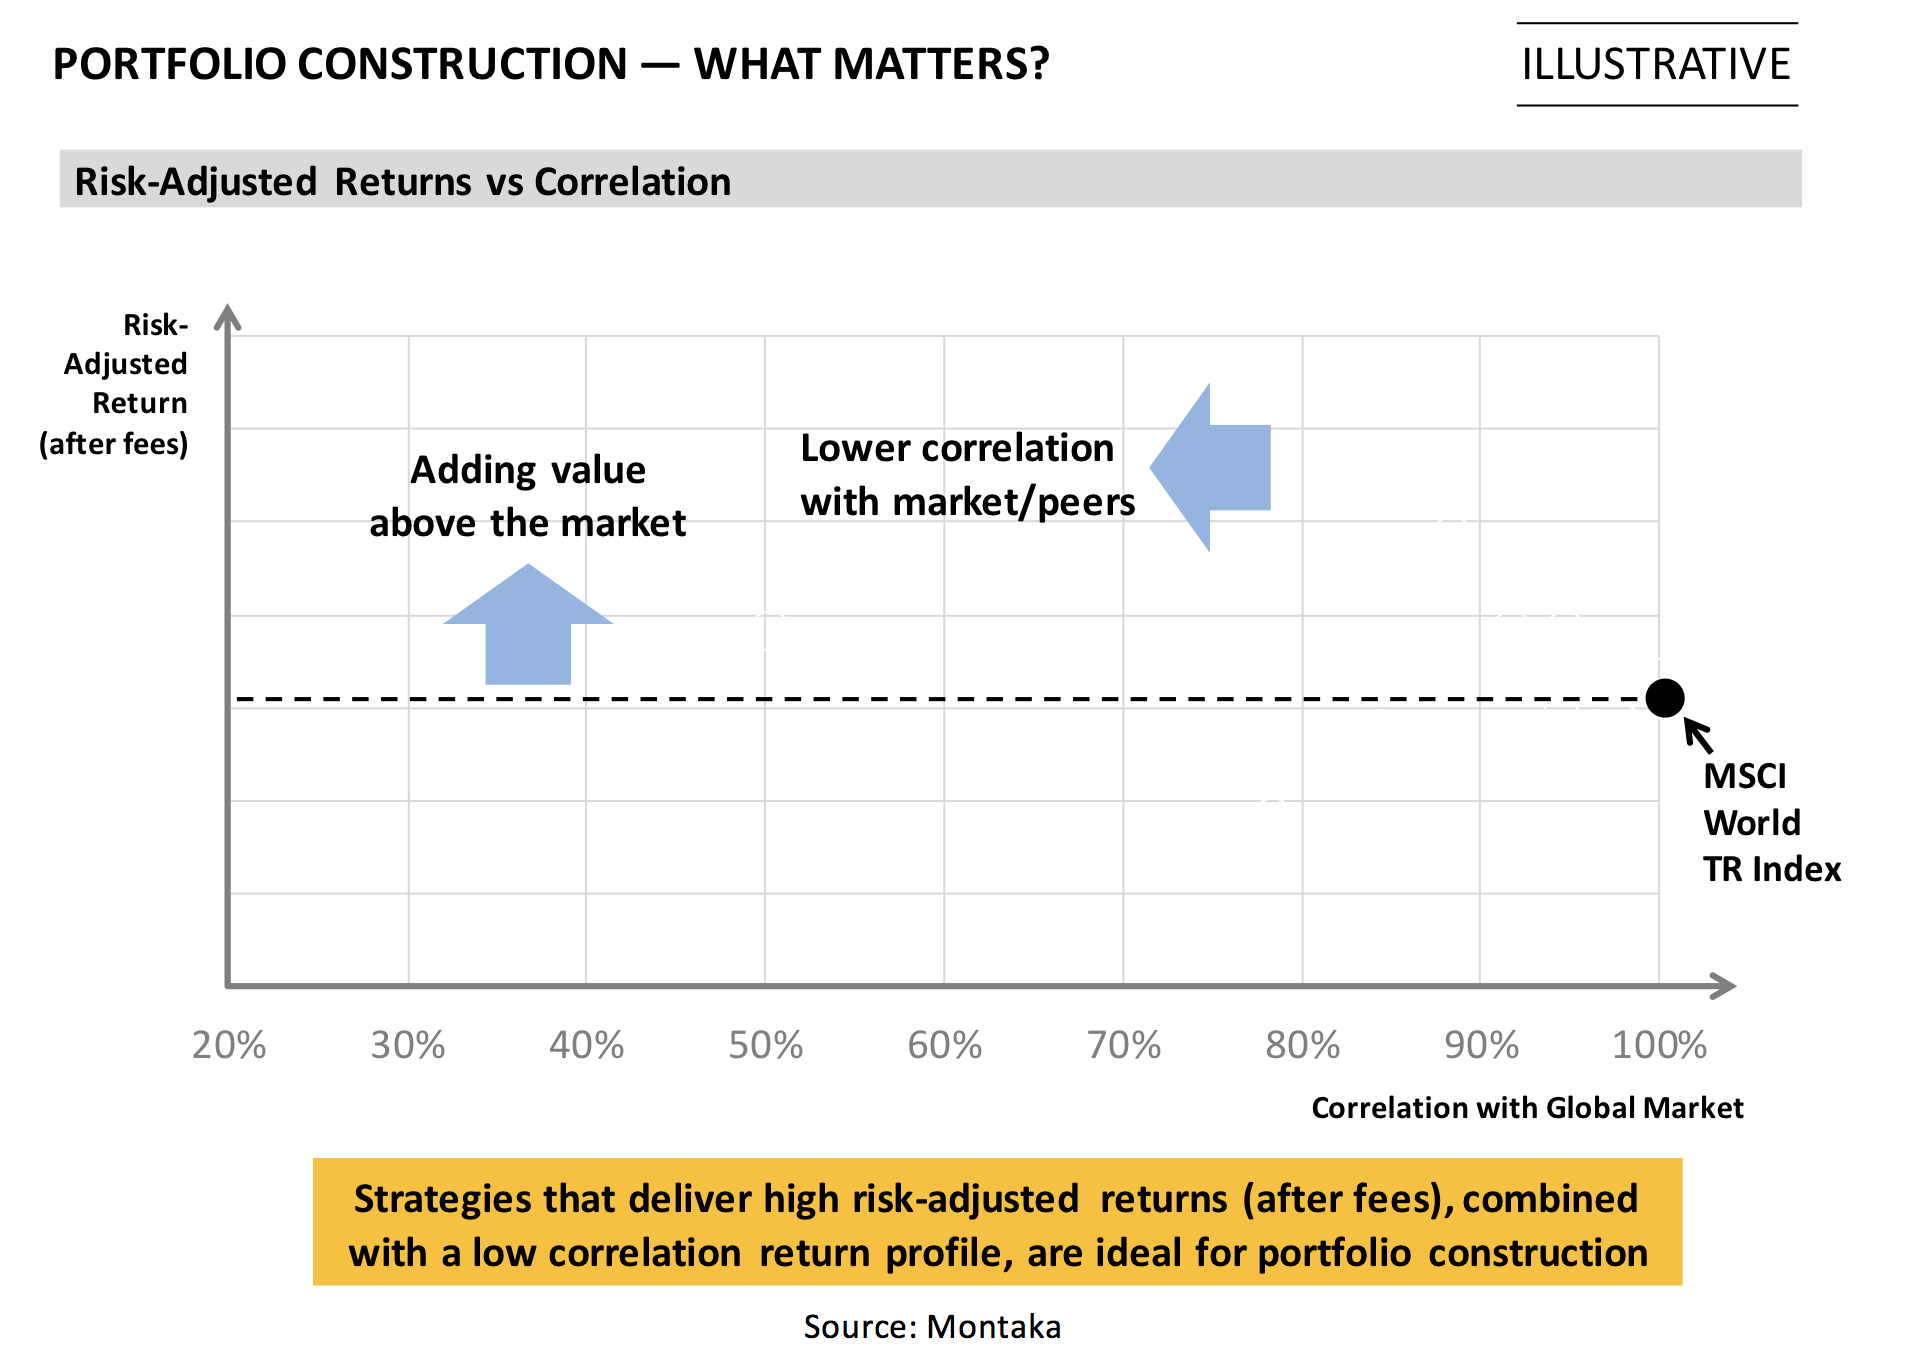
Now, as illustrated by the chart above, the optimal manager would have risk-adjusted returns above the market index; and a correlation well below the market index.
And this is exactly what Montaka delivers, as shown by the chart below which applies the above mappings to the set of Australian-based global equity managers.
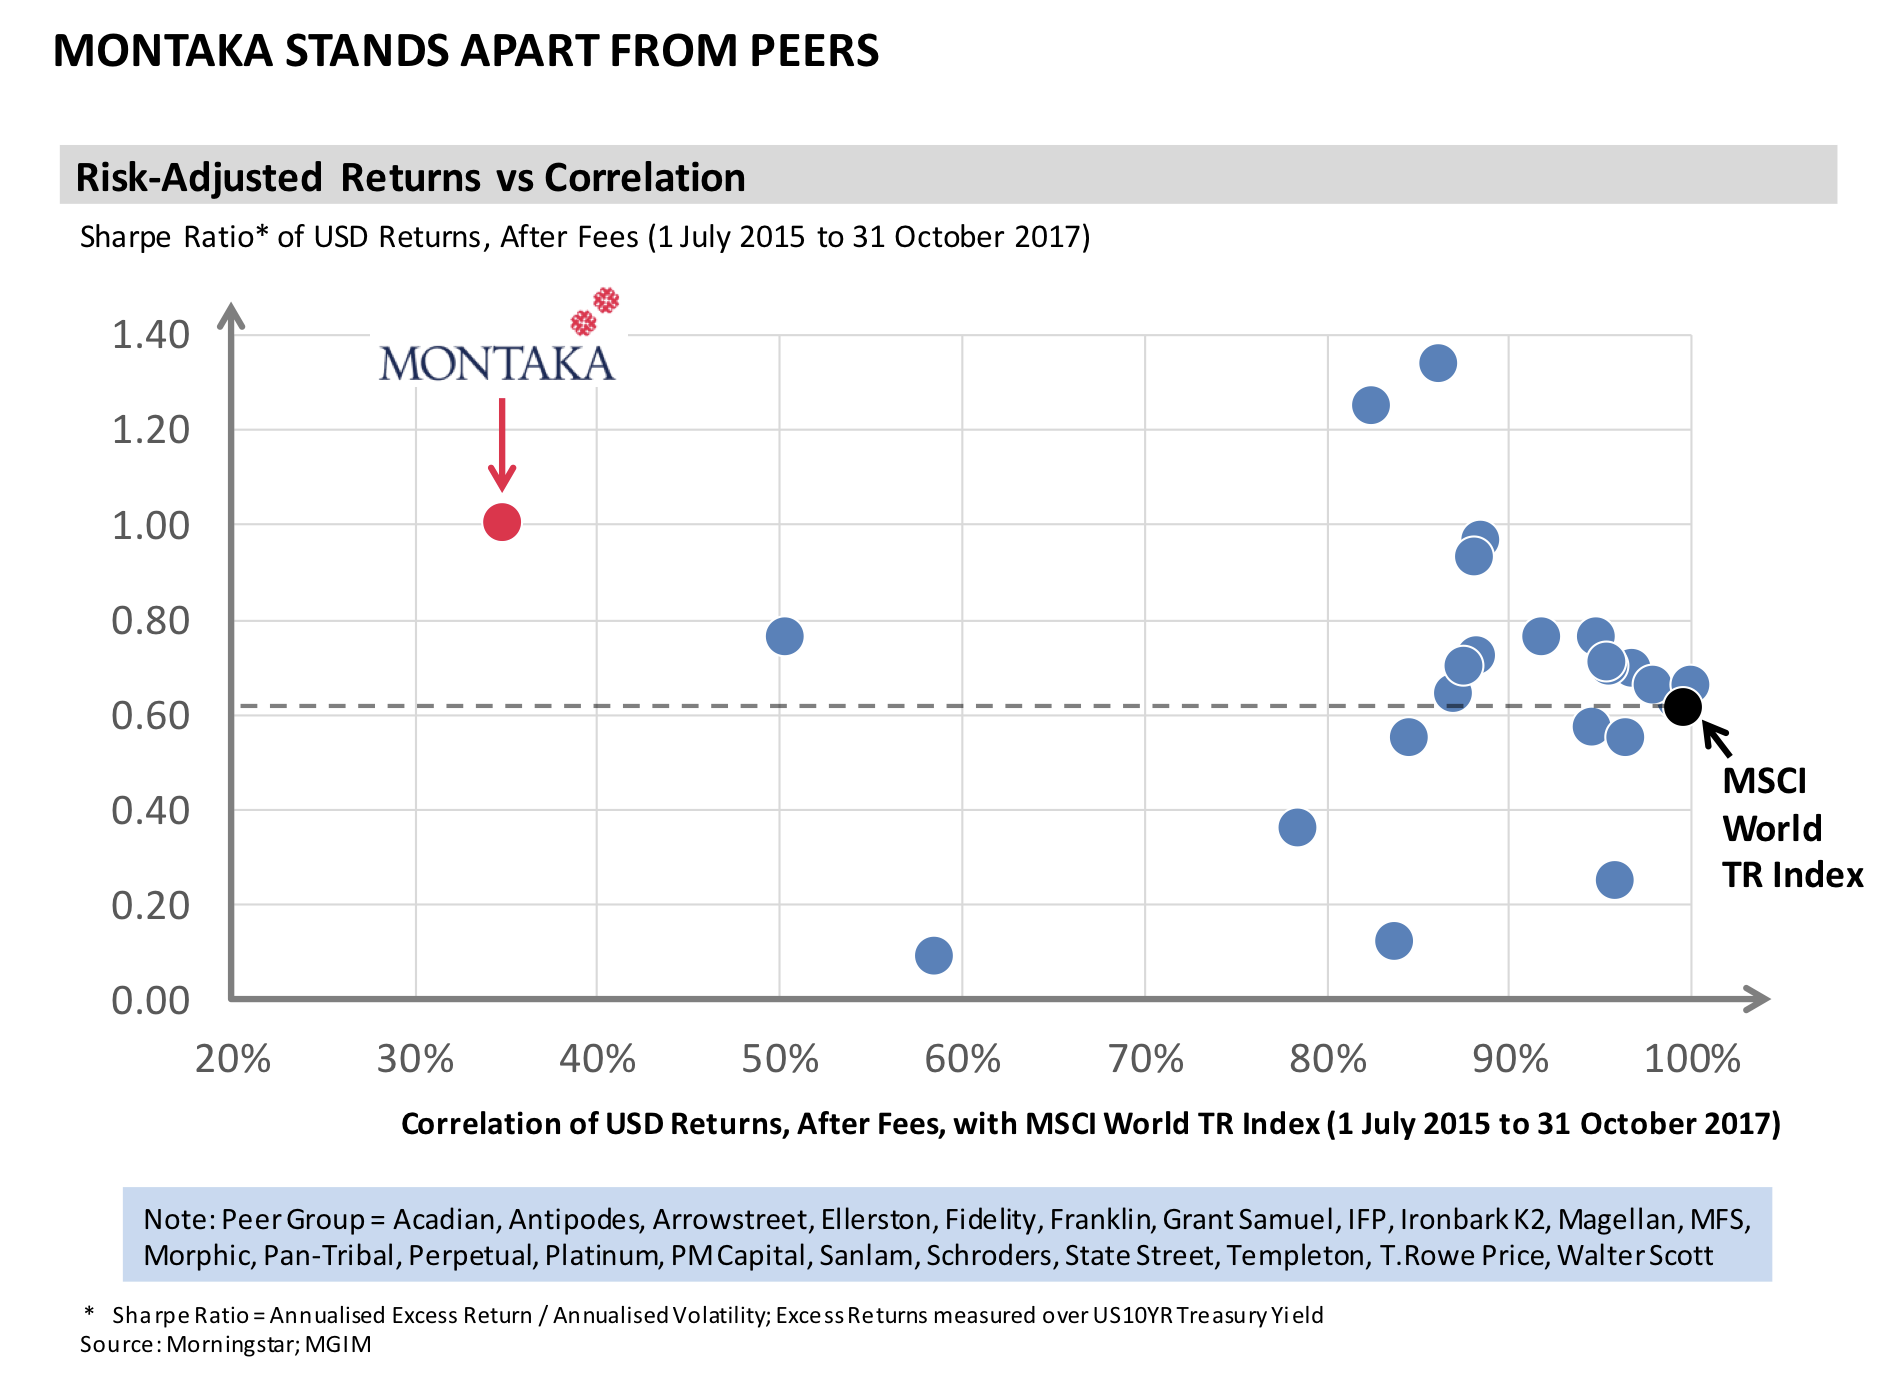
The other interesting observation from this mapping is the high degree to which Australian-based global managers are largely correlated to the global market index. Of course, the addition of a highly-correlated strategy to an existing portfolio does little to reduce portfolio risk.
To conclude with a simple example, the chart below shows the optimal selection of managers from the peer group we have analysed. The two managers we have selected:
- Have demonstrated risk-adjusted returns well above those of the market index; and
- Are lowly correlated with each other. This means, upon blending the returns of these two managers together in a single portfolio, the overall portfolio risk is materially reduced.
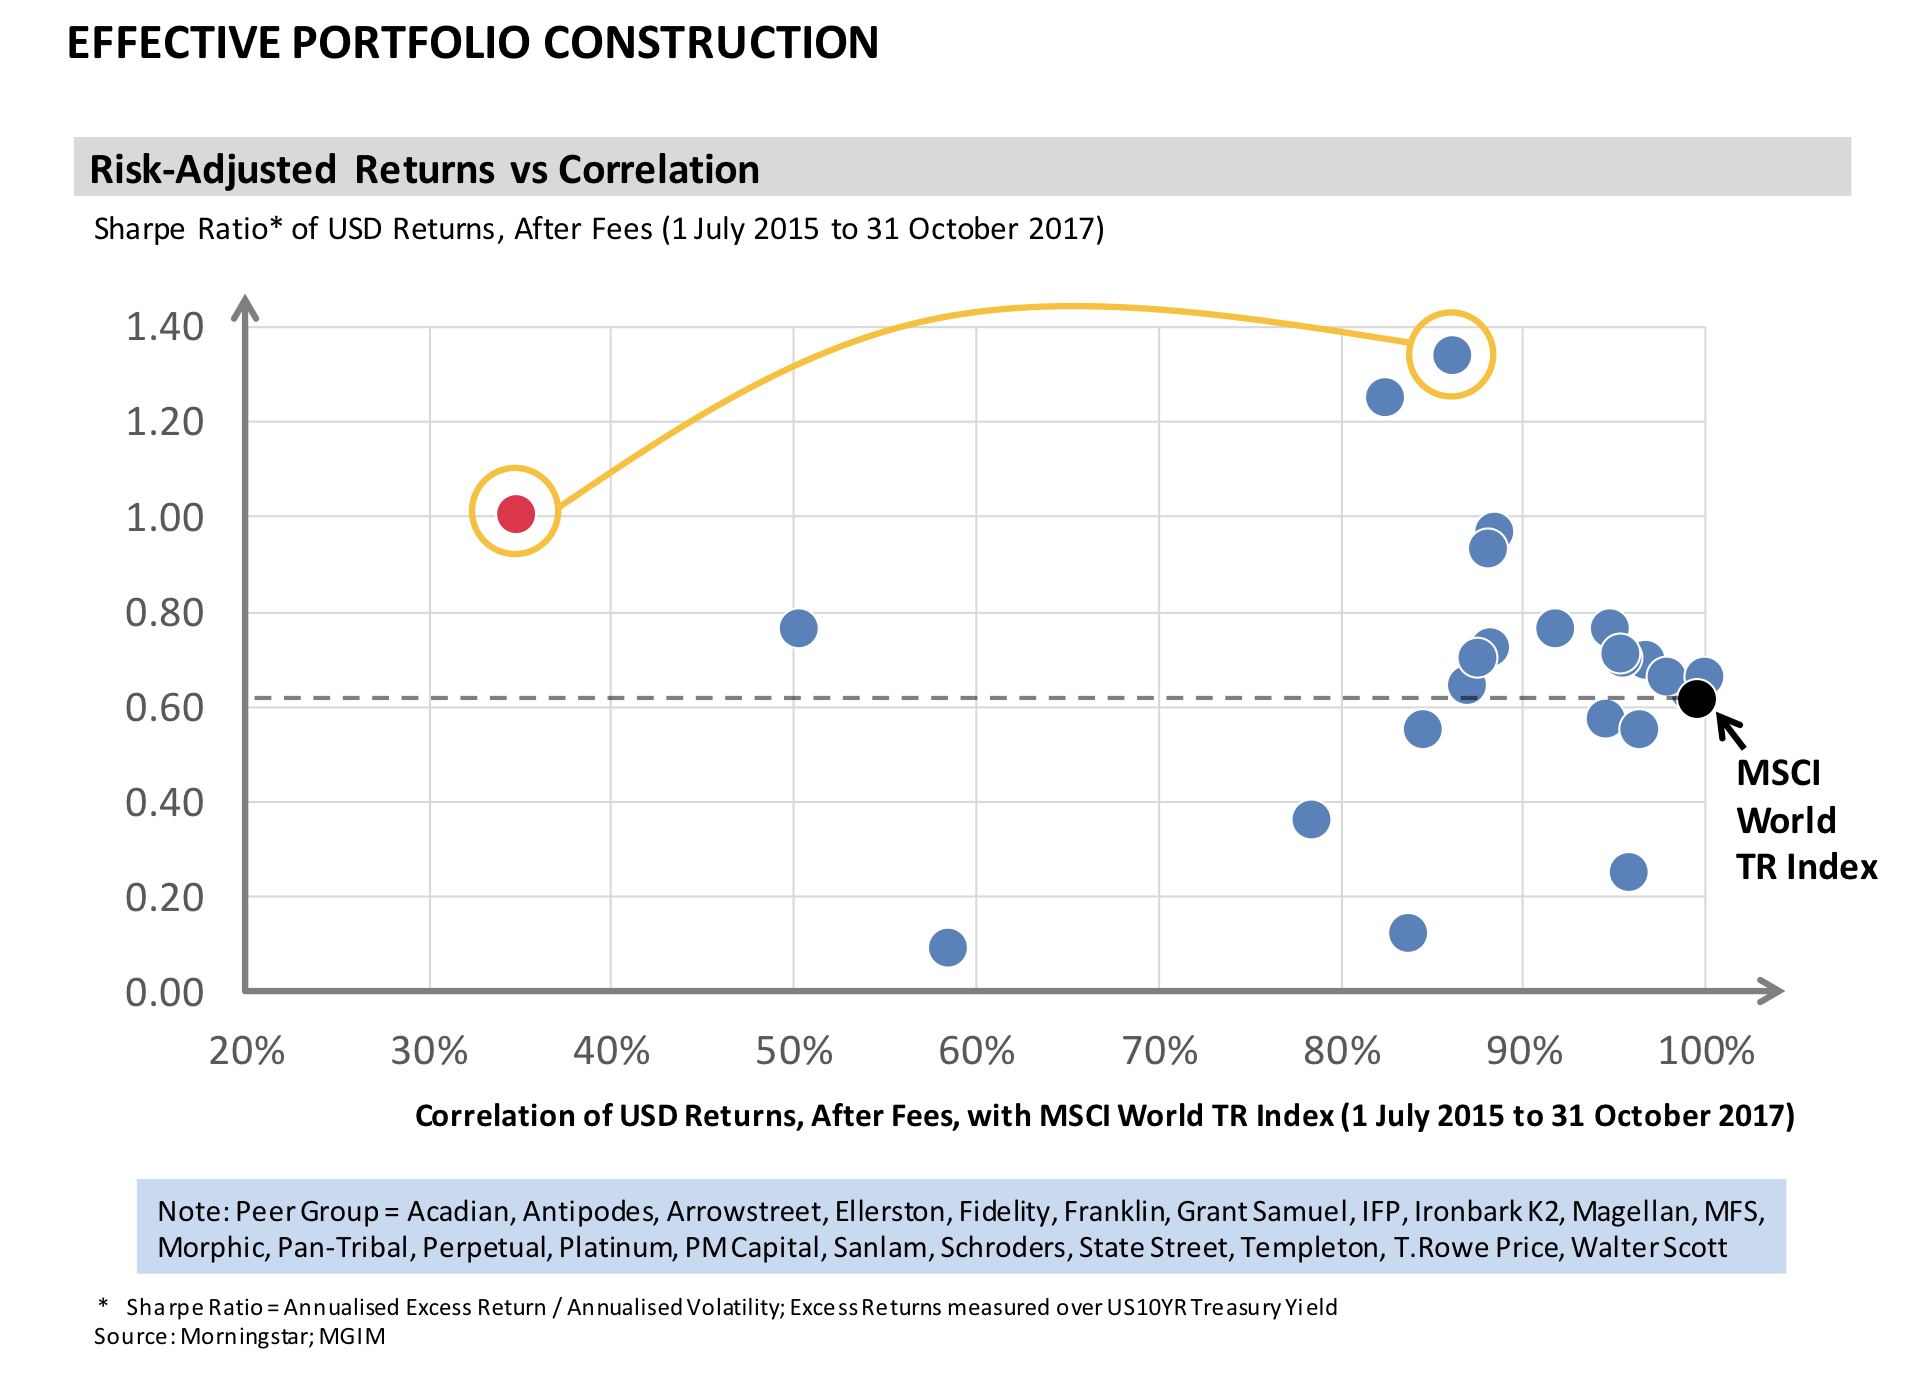
No other combination of two managers would be expected to generate risk-adjusted returns as high as the combination we have selected. And we believe our framework dramatically simplifies this otherwise daunting task.
[1] We recommend against Australian investors employing a Sharpe Ratio of the AUD returns of a global strategy. The significant volatility in the AUD/USD exchange rate results in systematic understatement of Sharpe Ratios; and systematic overstatement of correlation.
![]() Andrew Macken is Chief Investment Officer with Montaka Global Investments. To learn more about Montaka, please call +612 7202 0100.
Andrew Macken is Chief Investment Officer with Montaka Global Investments. To learn more about Montaka, please call +612 7202 0100.