|
Getting your Trinity Audio player ready...
|
It can be hard enough to identify a skilled fund manager who follows a logical investment process with the utmost discipline, integrity and transparency. But when you do find one, the next question, of course, is: how does this new manager complement my existing portfolio?
There are a number of aspects to being complementary. It is not just about generating outsized returns. If the incremental manager also brings with them, say: a more attractive upside/downside capture; or has a lower correlation to the market and/or peer group managers, then this is typically desirable.
We recently analysed the characteristics of the Montaka Global Fund relative to major Australian peers. First on fund returns, after expenses, over the period since Montaka’s inception on July 1, 2015. As illustrated on the chart below, Montaka has delivered returns materially above the market; and above most major Australian peers as well.
Fund Performance, After Expenses (July 1, 2015 to September 30, 2016):
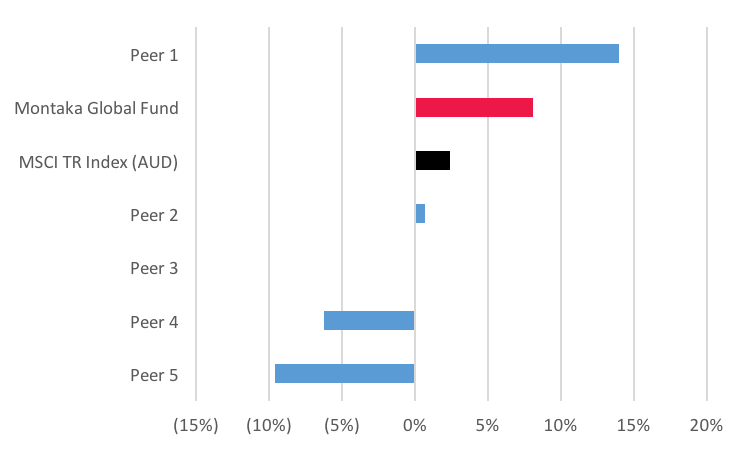
Source: Morningstar
Note: Peers include Antipodes, K2, Morphic, Platinum, PM Capital
But it is not just about outsized returns that make Montaka interesting. An examination of the return characteristics suggest Montaka is likely highly-complementary to other strategies that may already exist in your portfolio.
Of particular note is Montaka’s low correlation to the global market as well as to major Australian peers. Spend some time examining the correlation matrix below. Each box reflects the correlation of the returns of the two numbered strategies that correspond to the matrix cell.
What becomes very clear are two observations:
- Montaka’s correlation to the market is by-far the lowest of the peer group; and
- Montaka has by-far the lowest correlation to peers. It truly stands out as being unique.
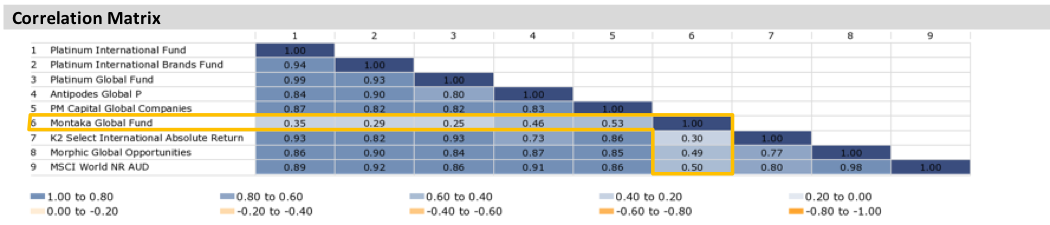
Source: Morningstar
A manager that can add value with a low correlation to one’s existing portfolio is extremely valuable. Blending high-quality strategies with low correlation to each other boosts the diversification benefits to the overall portfolio.
Finally, we examine the upside-downside capture of Montaka relative to the peer group. As a reminder, the way to read the chart below is as follows:
- The further to the left you are, the lower the amount of downside you capture when the market turns down (a highly attractive feature – and a measure of capital preservation); and
- The further to the top you are, the higher the amount of upside you capture when the market rises (also an attractive feature).
As shown, Montaka is a complete outlier on the chart with enormous downside protection. For us, this reiterates the message that Montaka exhibits a very different return profile to that of its major Australian peers. And this is valuable for owners of the strategy.
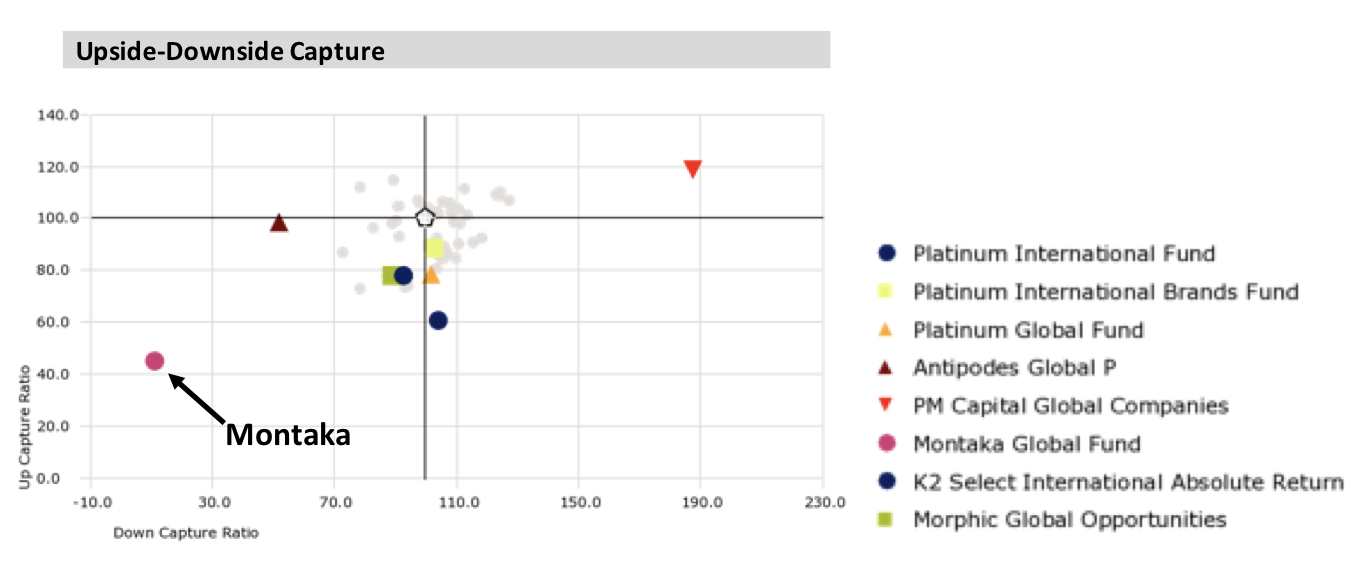 Source: Morningstar
On the basis described above, Montaka has delivered attractive returns over its 15-month life to date. But in addition, these returns have been delivered in a way that is likely highly-complementary to many existing portfolios. Montaka brings with it very low correlation to the market, extremely low correlation to peers and significantly higher capital preservation than Australian peer group managers.
![]() Andrew Macken is a Portfolio Manager with Montgomery Global Investment Management. To learn more about Montaka, please call +612 7202 0100.
Andrew Macken is a Portfolio Manager with Montgomery Global Investment Management. To learn more about Montaka, please call +612 7202 0100.