|
Getting your Trinity Audio player ready...
|
Over the last 12 months we have borne witness to one of the most significant portfolio reallocations of modern times. Investors have sold ~US$250bn of global equity funds and bought ~US$780bn of bond funds (inc money market). Looking at the difference between equity and bond flows (i.e. equity flows minus bonds flows), implies over US$1 trillion of net flows away from equities towards bonds. In fact, in dollar terms, this is the largest reallocation that we have ever been seen, and more than double the US$500bn net flow reallocation that occurred in 2008, which occurred at the depths of the Global Financial Crisis (GFC) when stocks a were heavily oversold. While the dollar value of the rotation is unprecedented, it’s worth noting that proportion of Assets Under Management (AUM) that moved away from equities, was twice as large in 2008 versus the last 12 months (~20% versus ~10% of AUM). Even so, the recent rotation is by far the largest we have seen since the GFC.
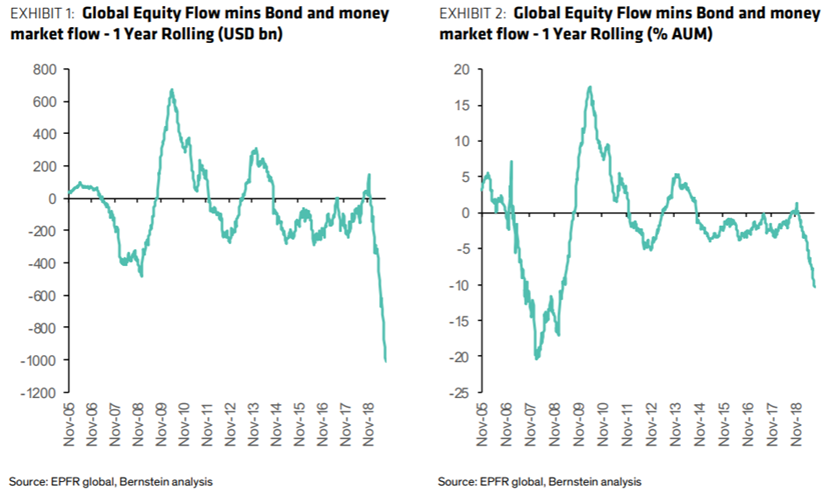
So what does this tell us? Let’s start by observing the current climate of ultra-low and negative interest rates across the world. Hence if allocation decisions are being made to tilt portfolios further in this direction (towards bonds), investors must have an incredibly bearish view for equity returns given they are willing to accept nothing, or a guaranteed loss (negative yields) in order to insulate themselves from equities.
Intriguingly, despite this significant headwind from outflows, equity markets are still up this year. Beyond stronger fundamentals, one of the possible reasons for this is that investor selling has been overwhelmingly offset by corporate buying. Global corporates have announced ~US$820bn of buybacks so far this year, in addition to ~US$1.3 trillion of total M&A, hence the buying of equities by corporates has exceeded selling by traditional investors by a factor of ten.
Looking back over the last ~15 years of relative net flows (equity flows minus bond flows) on a 6-month rolling basis, reveals an interesting data set. Applying a typical normal distribution to this data, whereby 99% of observations sit within 3 standard deviations of the mean, we observe a cyclical / sine wave type impulse of net flow movements (below). With the move in net flows observed over the last 12 months, representing a more than 3-standard deviation extreme at the beginning of 2019 (immediately after the sharp sell-off into the close of 2018). In fact, net flows are still at an extended position today, more than 2-standard deviations from the mean.
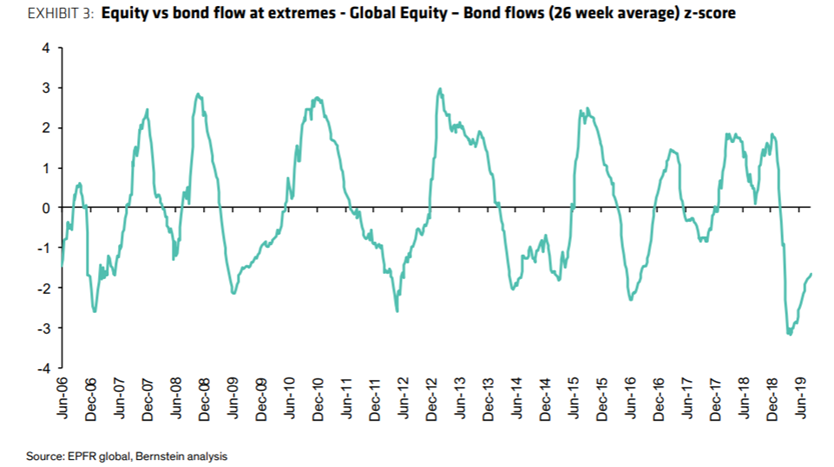
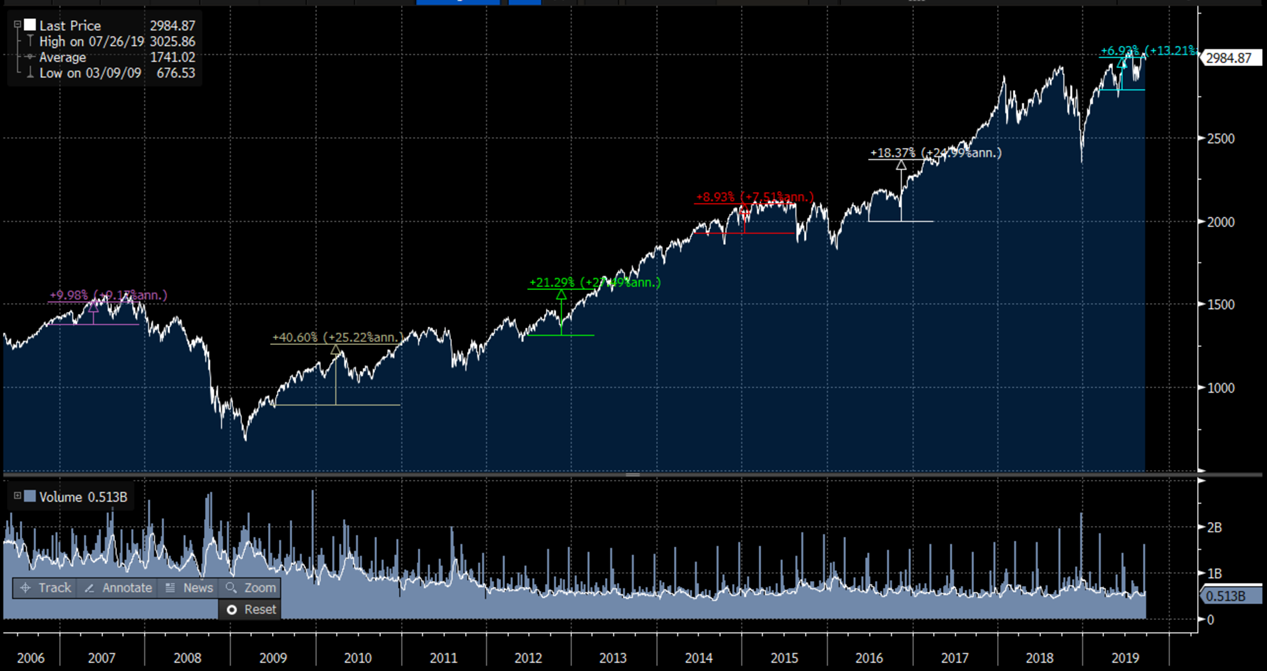
So the natural question is, “what happens to stocks, when net flows move through a half-cycle (from trough to peak)?”. In other words, when net flows move from a negative 3-standard deviation extreme to a positive 3. While the magnitude of stock moves is inconclusive, there is a directional pattern that is observed. In prior five cycles (from 2006 through 2016), when net flows moved from negative 3-standard deviations to positive 3, the stock market has always gone up, and on average it has increased by ~20% each time. Assuming 2019 marked the start of another cycle, we may still have some room to run for equities given stocks have only risen ~7% and net flows remain negative 2-standard deviations below the mean.
S&P 500 Index Performance Around Net Flow Cycles (i.e. moves from negative 3-standard deviations to positive 3)
While the team at Montaka Global practices a bottoms-up, fundamental, value investing framework for our stock selection, it is often useful to have a rounded perspective of what the world looks like on a purely technical basis, which is largely what this blog post reflects.
 Amit Nath is a Senior Research Analyst with Montaka Global Investments. To learn more about Montaka, please call +612 7202 0100.