For the first time since the Fed began its quantitative easing program in 2009, the FOMC announced in June it would start a gradual unwind of its balance sheet sometime this year. For those who could benefit from a simple explanation of what this means, see the following bullet points:
- Prior to the Fed embarking on its new quantitative easing program, it routinely controlled the short-term interest rate as a means to influence the money supply in the economy. If the short-term rate was low, banks could fund their lending cheaply which would result in lower borrowing costs for households and corporates. These lower borrowing costs would, in turn, typically result in higher demand for credit. More credit equals more money in the economy which is inflationary. So this was the typical mechanism by which the Fed could influence inflation: if it wanted more, cut the short-term rate; if it wanted less, increase the short-term rate.
- A problem arose in 2009 when the Fed had already cut the short-term rate to zero and yet the economy was still in desperate need of additional stimulus. To achieve this, the Fed, for the first time, engaged in quantitative easing by which it acquired longer-term bonds in the form of Treasuries and mortgage-backed securities in the open market. By buying in such enormous quantity the Fed was easily able to push the price of these bonds upwards – which is equivalent to pushing the yield on these bonds downwards. By artificially forcing treasury and mortgage rates down, borrowing costs for households and corporates became lower and asset prices (in particular property and equities) started to rise.
- The goal here was to stimulate asset prices to create a positive wealth effect under which households feel wealthier and increase consumption. Given the US is such a consumption-led economy, stronger consumption is key to a healthier US economy.
- Now a quick important technical point: the nature of a bond is that it has a fixed maturity date at which point the bond principal is paid to the owner by the issuer. So the Fed, as the owner of a significant number of bonds, would receive enormous payments of principal from the maturing of these various bonds at different times. But the payment of cash to the Fed is akin to reducing the money supply from the broader economy which is disinflationary. To negate this effect, the Fed chose to reinvest all of the proceeds from principal repayments into new bonds.
Which brings us back to June’s announcement. The Fed announced that, starting this year, it would stop reinvesting all of its principal repayments back into new bonds. Specifically:
- For payments of principal that the Federal Reserve receives from maturing Treasury securities, the Committee anticipates that the cap will be US$6 billion per month initially and will increase in steps of US$6 billion at three-month intervals over 12 months until it reaches US$30 billion per month.
- For payments of principal that the Federal Reserve receives from its holdings of agency debt and mortgage-backed securities, the Committee anticipates that the cap will be $4 billion per month initially and will increase in steps of US$4 billion at three-month intervals over 12 months until it reaches US$20 billion per month.
- The Committee also anticipates that the caps will remain in place once they reach their respective maximums so that the Federal Reserve’s securities holdings will continue to decline in a gradual and predictable manner until the Committee judges that the Federal Reserve is holding no more securities than necessary to implement monetary policy efficiently and effectively.
On the one hand this is a very gradual normalisation: under this policy it would take approximately 8 years to completely normalise the Fed’s balance sheet. On the other hand, a major buyer of Treasuries and mortgage-backed securities is exiting the market. This should result in weaker bond prices and higher bond yields. And this means higher borrowing costs for corporates and households – which, in theory, can handle these higher rates since the economy has strengthened.
At this point, it is important to clearly understand the difference between a stock of assets on a central bank’s balance sheet; and a flow of money into an economy when that stock of assets increases; or a flow of money withdrawn from an economy when that stock of assets decreases.
Shown below is JP Morgan’s aggregation of the assets on the four major central banks: the Fed (US), the ECB (Europe), the BoJ (Japan) and BoE (UK). The blue line shows the aggregate level of assets on the four central banks’ balance sheets since the Global Financial Crisis (GFC). And the orange line shows the “flow” which relates to the annual change in this stock of assets.
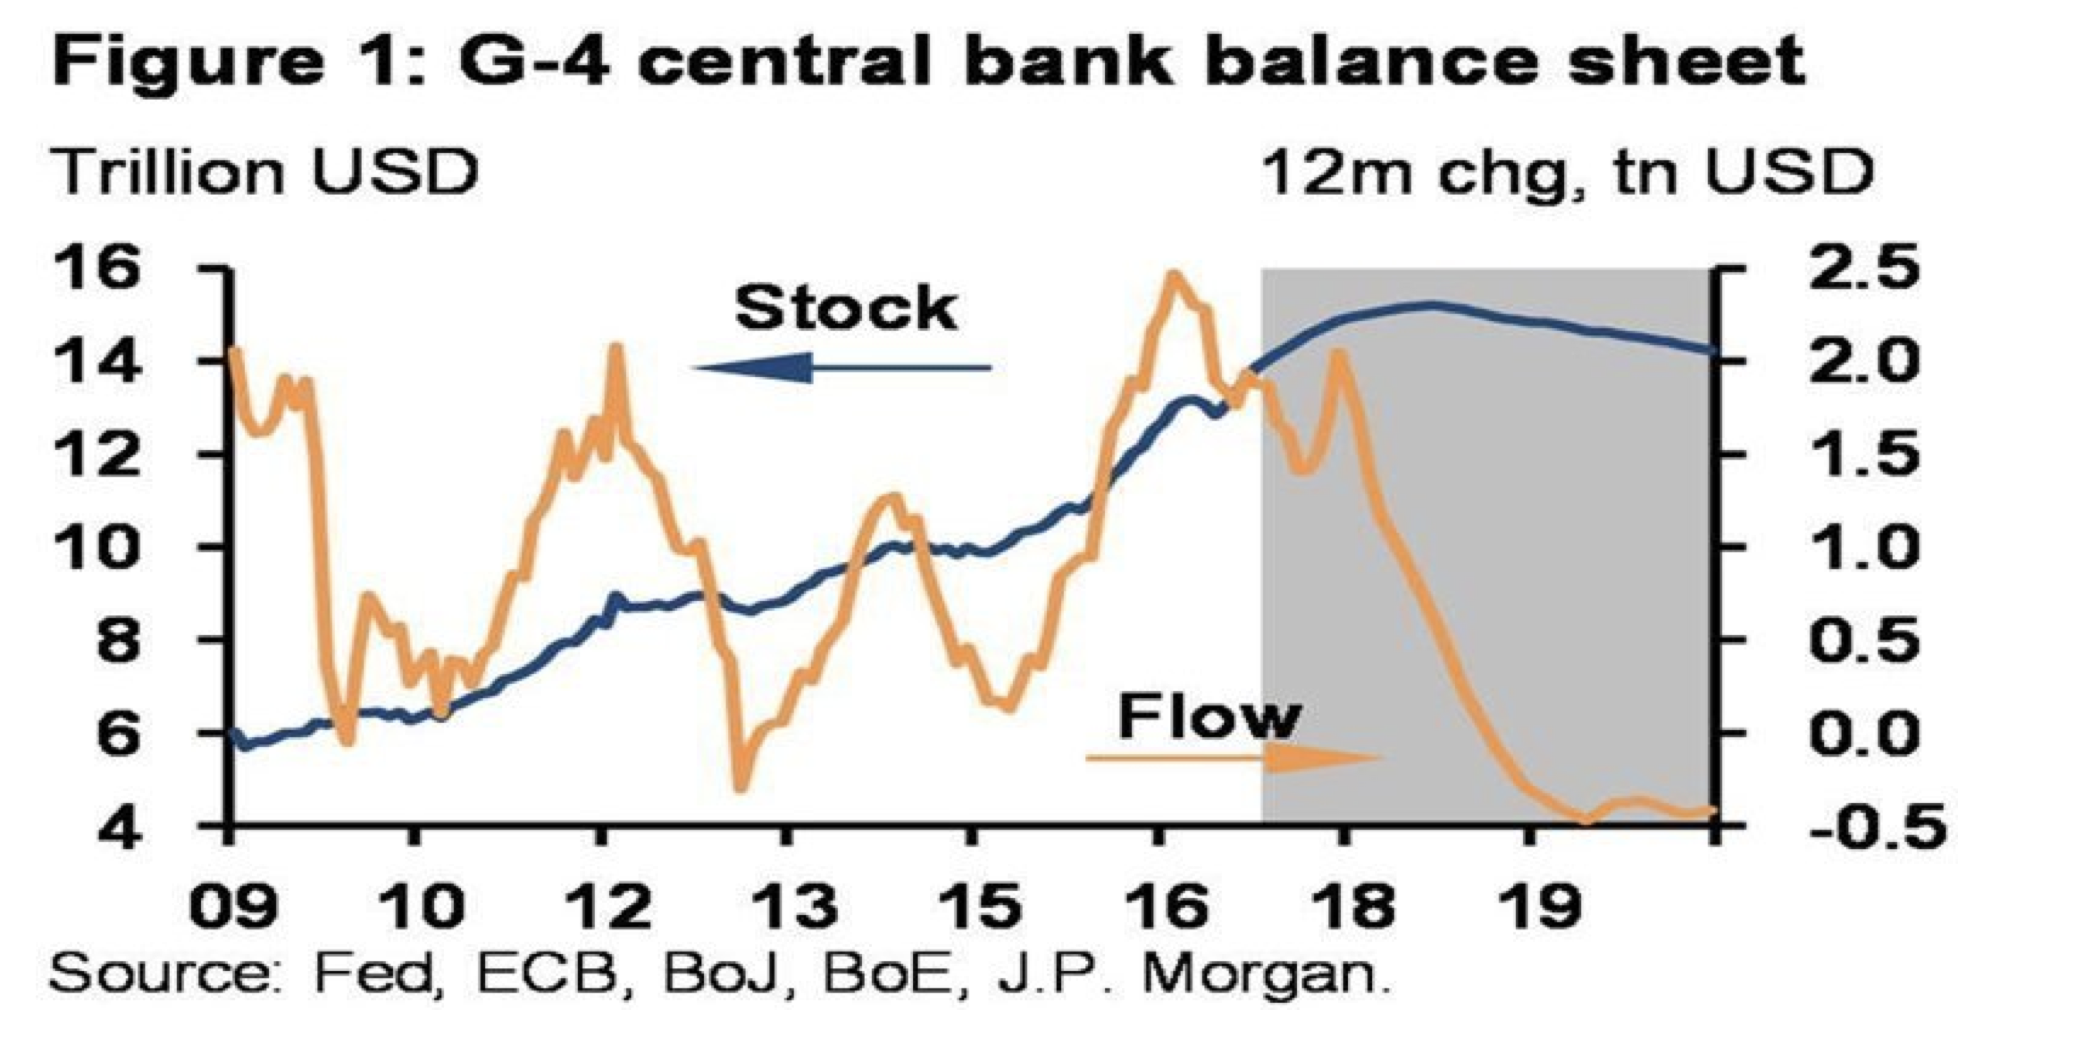
There is a logical hypothesis that, since the GFC, the US$14 trillion of aggregate bond buying by these four central banks has pushed investors up the risk spectrum. The mechanics are as follows:
- The buying of sovereign bonds and mortgage-backed-securities by these central banks created a relative shortage of these securities.
- Investors who preferred to own these securities, faced with a shortage, were forced to buy slightly more risky securities, such as AAA-rated corporate bonds.
- But this now created a shortage of these AAA-rated securities. So would-be owners of these bonds were forced to own slightly more risky bonds… And so on.
- At some point, would-be bond investors were forced to own equities – perhaps “bond substitute” equities with high dividend-yields. (Sound familiar?)
We can see some evidence of this in the data which relates to pension fund asset allocation, as shown below. The P7 relates to the pension assets of the US, Australia, UK, Canada, Netherlands, Switzerland and Japan. Today, these assets aggregate to more than US$33 trillion – so the data is meaningful.
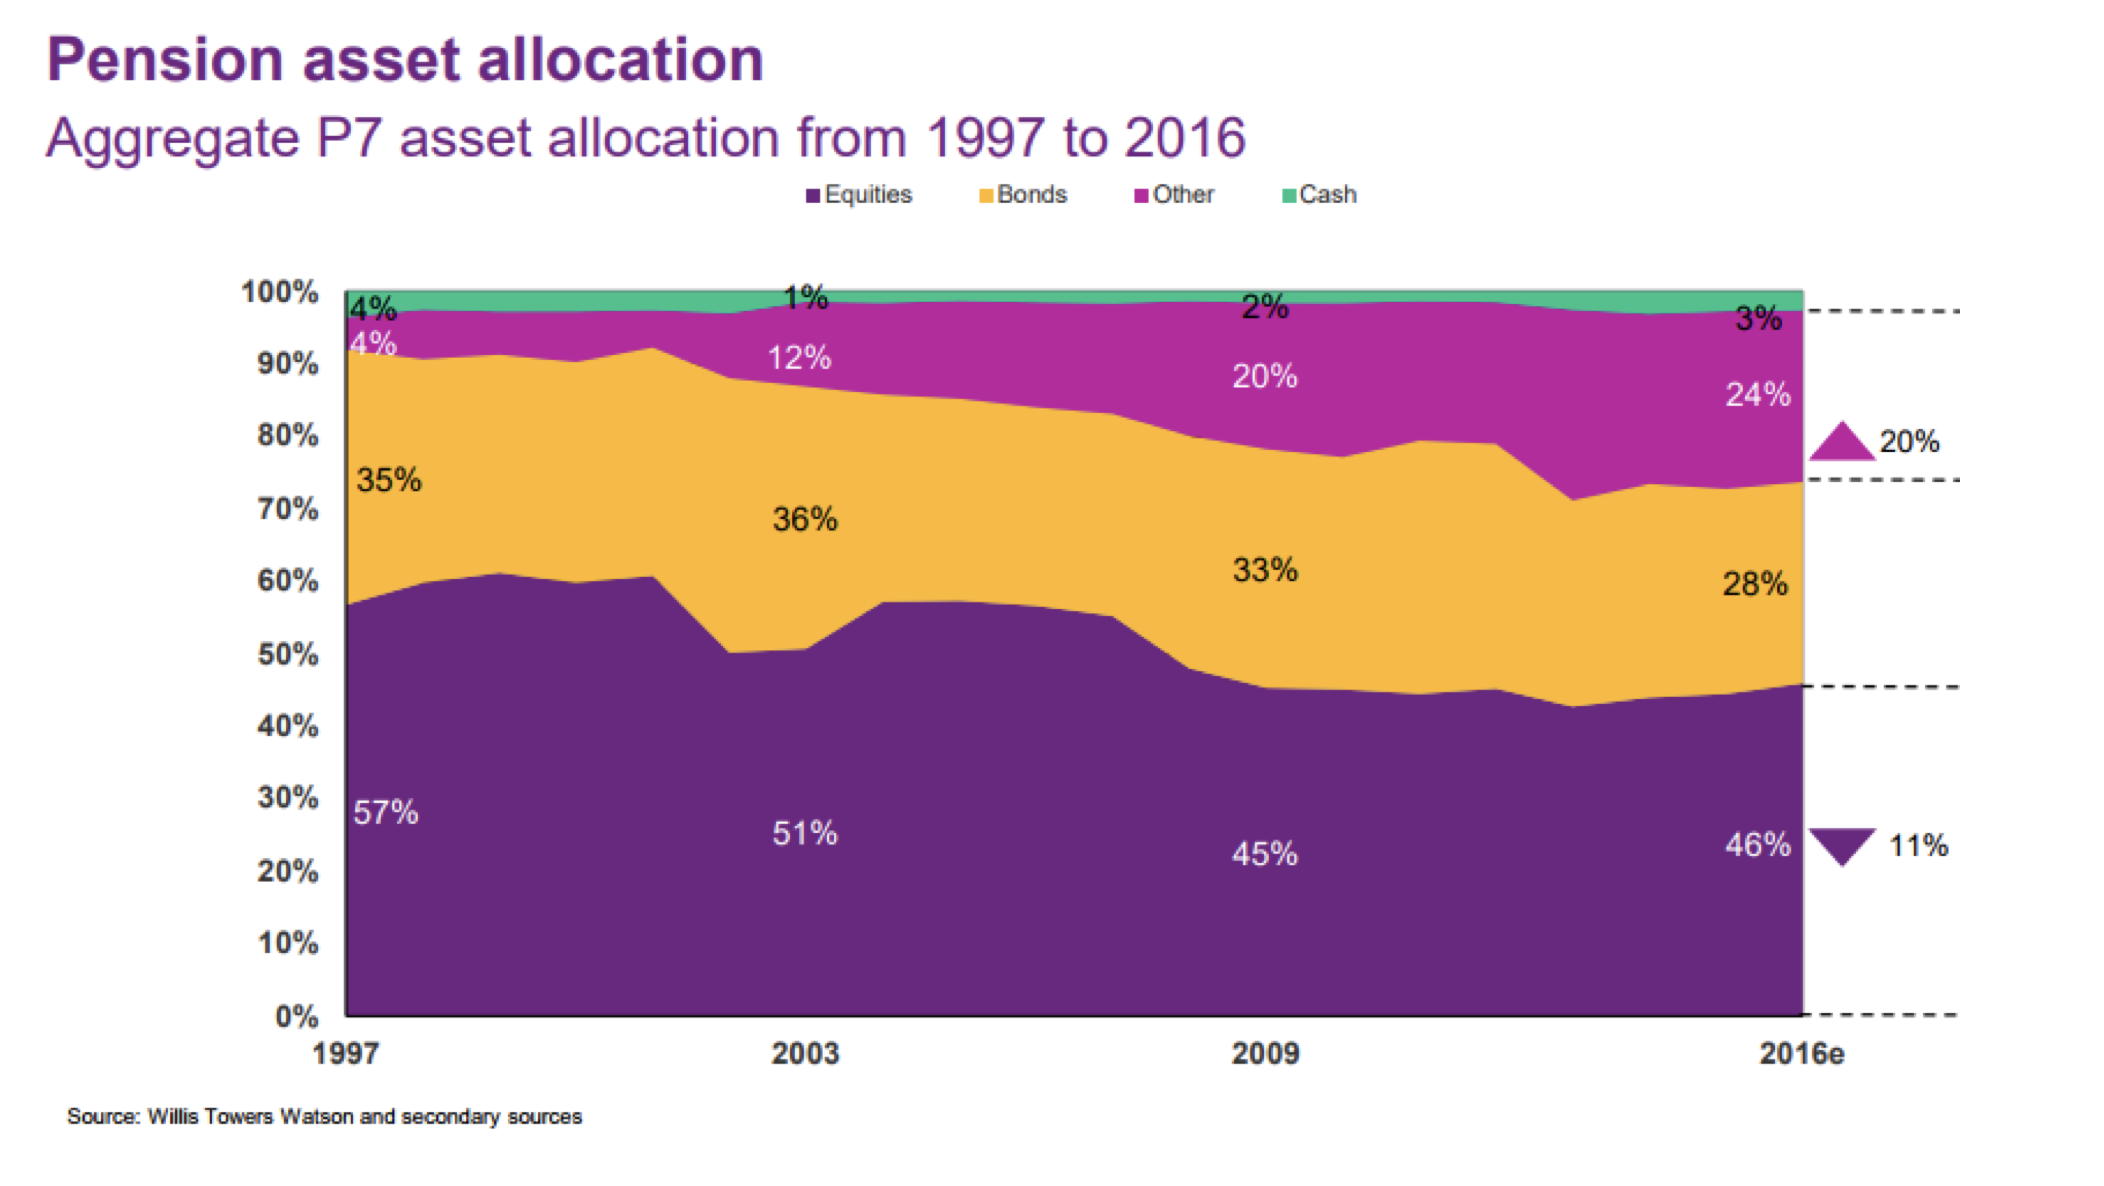 As can be observed, holdings of bonds declined from around 33% in 2009 to 28% in 2016. And it appears that at least 80% of this change, or 4 percentage points, related to an increase in “Other”.
Now, “Other” consists of real-estate, private equity (PE) and hedge-funds. So the subtle implication of the chart above is that, from the P7’s pension assets alone, approximately US$3 trillion[1] has flowed into real-estate and PE/hedge-fund assets.
Could this have resulted in inflated property and/or equity valuations in the world? Quite possibly. And what happens if these central banks begin to contract their respective balance sheets as the Fed plans to later this year?
Well, your author recently spoke to a US$20 billion+ macro hedge fund based in New York. Their clients include large pension funds that are included in the data above. In conversations, their clients have suggested to them that if bond yields back up – possibly as a result of the Fed’s planned balance sheet normalisation – they will be in the market buying these Treasuries and mortgage-backed-securities in size.
That is, pension fund allocators are looking to rebuild their allocation to bonds as quickly as possible when attractive yields present themselves. And where will the money come from to buy these bonds? Property and equities, most likely.
This is why we are running a conservative book in our Montaka strategy at present. Our net market exposure is currently around 40%. We cannot predict the future of equity market returns, but we can foresee a very possible scenario in which central bank balance sheet normalisation causes a withdrawal of capital from equity markets. And should that day come, we feel well prepared to pounce on new opportunities as and when they present themselves.
[1] Includes growth in pension assets of +4%pa; plus additional 4 percentage points in allocation to real-estate, private equity and hedge fund assets.

Andrew Macken is a Portfolio Manager with Montgomery Global Investment Management. To learn more about Montaka, please call +612 7202 0100.

Will Balance Sheet Normalisation Deflate Asset Prices?
For the first time since the Fed began its quantitative easing program in 2009, the FOMC announced in June it would start a gradual unwind of its balance sheet sometime this year. For those who could benefit from a simple explanation of what this means, see the following bullet points:
Which brings us back to June’s announcement. The Fed announced that, starting this year, it would stop reinvesting all of its principal repayments back into new bonds. Specifically:
On the one hand this is a very gradual normalisation: under this policy it would take approximately 8 years to completely normalise the Fed’s balance sheet. On the other hand, a major buyer of Treasuries and mortgage-backed securities is exiting the market. This should result in weaker bond prices and higher bond yields. And this means higher borrowing costs for corporates and households – which, in theory, can handle these higher rates since the economy has strengthened.
At this point, it is important to clearly understand the difference between a stock of assets on a central bank’s balance sheet; and a flow of money into an economy when that stock of assets increases; or a flow of money withdrawn from an economy when that stock of assets decreases.
Shown below is JP Morgan’s aggregation of the assets on the four major central banks: the Fed (US), the ECB (Europe), the BoJ (Japan) and BoE (UK). The blue line shows the aggregate level of assets on the four central banks’ balance sheets since the Global Financial Crisis (GFC). And the orange line shows the “flow” which relates to the annual change in this stock of assets.
There is a logical hypothesis that, since the GFC, the US$14 trillion of aggregate bond buying by these four central banks has pushed investors up the risk spectrum. The mechanics are as follows:
We can see some evidence of this in the data which relates to pension fund asset allocation, as shown below. The P7 relates to the pension assets of the US, Australia, UK, Canada, Netherlands, Switzerland and Japan. Today, these assets aggregate to more than US$33 trillion – so the data is meaningful.
Now, “Other” consists of real-estate, private equity (PE) and hedge-funds. So the subtle implication of the chart above is that, from the P7’s pension assets alone, approximately US$3 trillion[1] has flowed into real-estate and PE/hedge-fund assets.
Could this have resulted in inflated property and/or equity valuations in the world? Quite possibly. And what happens if these central banks begin to contract their respective balance sheets as the Fed plans to later this year?
Well, your author recently spoke to a US$20 billion+ macro hedge fund based in New York. Their clients include large pension funds that are included in the data above. In conversations, their clients have suggested to them that if bond yields back up – possibly as a result of the Fed’s planned balance sheet normalisation – they will be in the market buying these Treasuries and mortgage-backed-securities in size.
That is, pension fund allocators are looking to rebuild their allocation to bonds as quickly as possible when attractive yields present themselves. And where will the money come from to buy these bonds? Property and equities, most likely.
This is why we are running a conservative book in our Montaka strategy at present. Our net market exposure is currently around 40%. We cannot predict the future of equity market returns, but we can foresee a very possible scenario in which central bank balance sheet normalisation causes a withdrawal of capital from equity markets. And should that day come, we feel well prepared to pounce on new opportunities as and when they present themselves.
[1] Includes growth in pension assets of +4%pa; plus additional 4 percentage points in allocation to real-estate, private equity and hedge fund assets.
Andrew Macken is a Portfolio Manager with Montgomery Global Investment Management. To learn more about Montaka, please call +612 7202 0100.
This content was prepared by Montaka Global Pty Ltd (ACN 604 878 533, AFSL: 516 942). The information provided is general in nature and does not take into account your investment objectives, financial situation or particular needs. You should read the offer document and consider your own investment objectives, financial situation and particular needs before acting upon this information. All investments contain risk and may lose value. Consider seeking advice from a licensed financial advisor. Past performance is not a reliable indicator of future performance.
Related Insight
Share
Get insights delivered to your inbox including articles, podcasts and videos from the global equities world.