How is it that, in the world’s largest economy, unemployment is down, the housing market is strong, the Fed has started to raise rates – and yet, the agricultural sector is in a downturn more severe than during the Global Financial Crisis (GFC)? It’s somewhat of a contradiction to say the least.
The US economy is large and diverse. So generalizing its state as good, bad or otherwise is typically not particularly meaningful. At the very least, one needs to consider the key segments of the economy to arrive at any sensible conclusions.
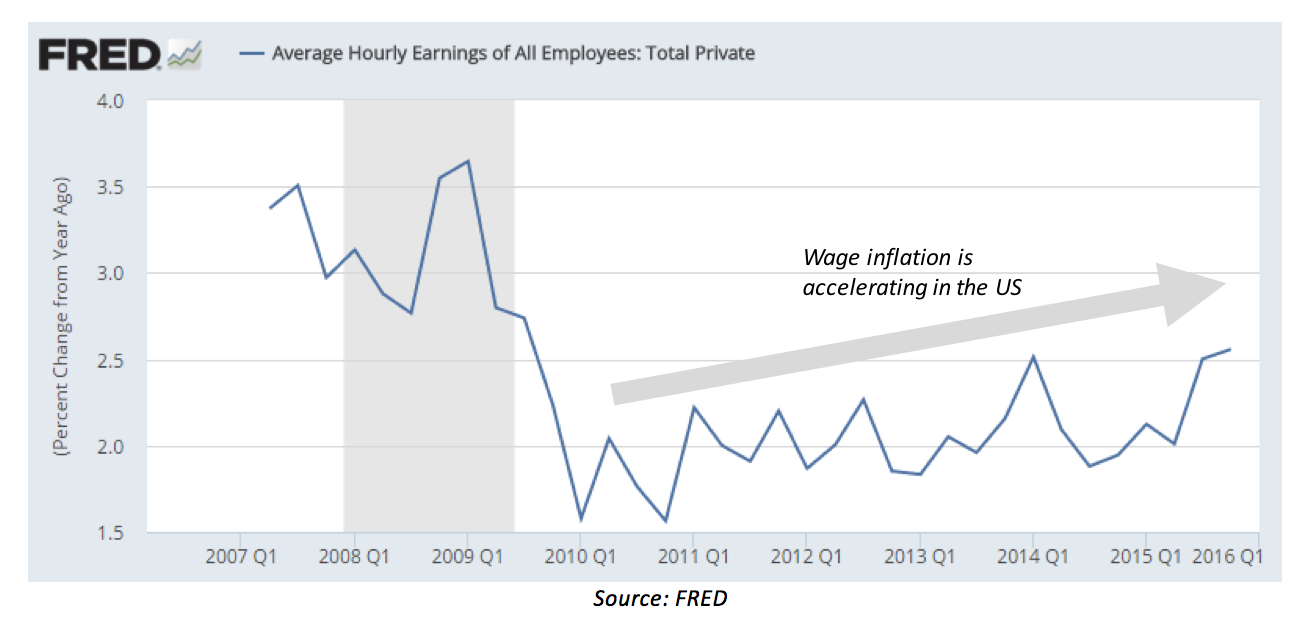
Let’s start with the consumer. We know that wages are growing in the US; and we know that this growth is gently accelerating, as illustrated below.
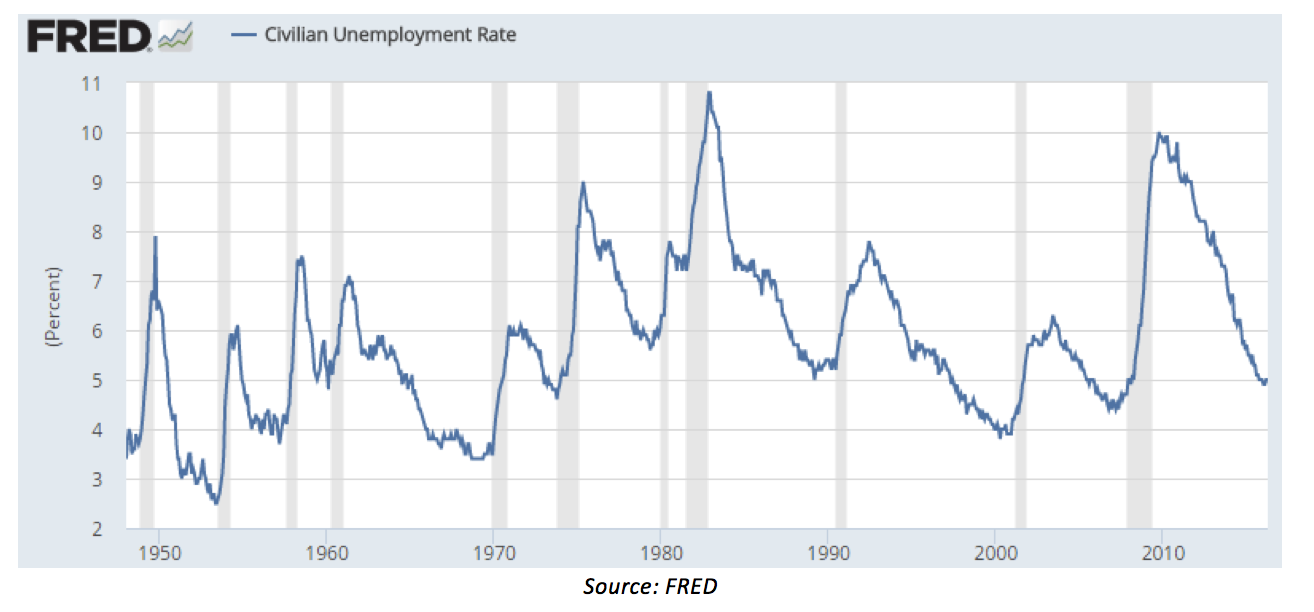
Key measures of employment are improving. As illustrated below, the official civilian unemployment rate has recovered from the GFC and is back to historically normal levels.
We are seeing strength amongst small businesses – the provider of more than half the jobs in the US. On its most recent conference call, Insperity (NYSE: NSP) – a leading professional employer organization that co-employs around 160k small business employees across the US – highlighted a clear improvement in the space. Here is what the CEO had to say:
- “I keep an eye on what I would call a capacity measure, which is the percentage of overtime pay to regular pay; and we generally look for a 10% or better number to indicate the need to hire new employees… But also, their pipelines for new business have to be good enough to where they think that’s going be sustained for a while and they actually would make more money by hiring new people than just working overtime.
- So, the other thing I look at is the commissions paid to the sales staff of our client as we run all the payrolls. We’re able to compare, on a year-over-year basis, the percentage of base pay and commissions in one period for a group of employees, compared to the same group a year ago… We also look for that number to be strong enough typically over around 8% or so to support – not just the need for new employees but the likelihood that they need them as full time on an ongoing basis.
- So, actually, this quarter was the first time really since the 2008 period that we’ve seen both of those numbers finally at the level we’re looking for over time is 10%.”
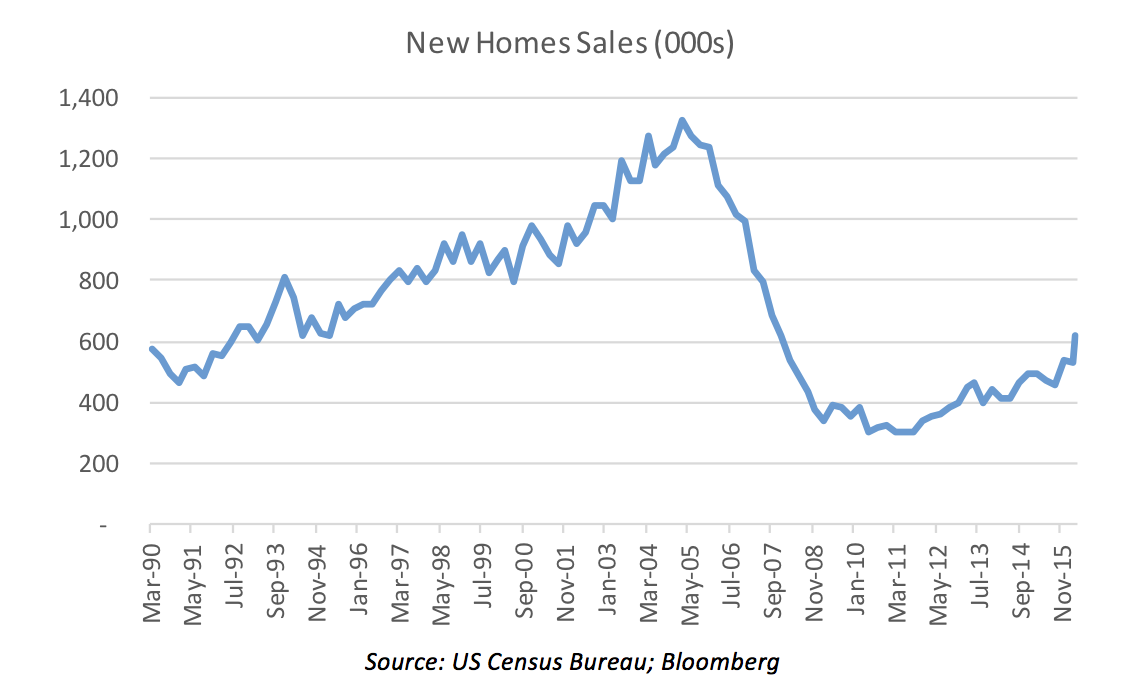
Next we move onto the housing market – arguably the most important asset class for the consumer. And here we are also seeing strength. New home sales are at their highest since 2008, as shown below.
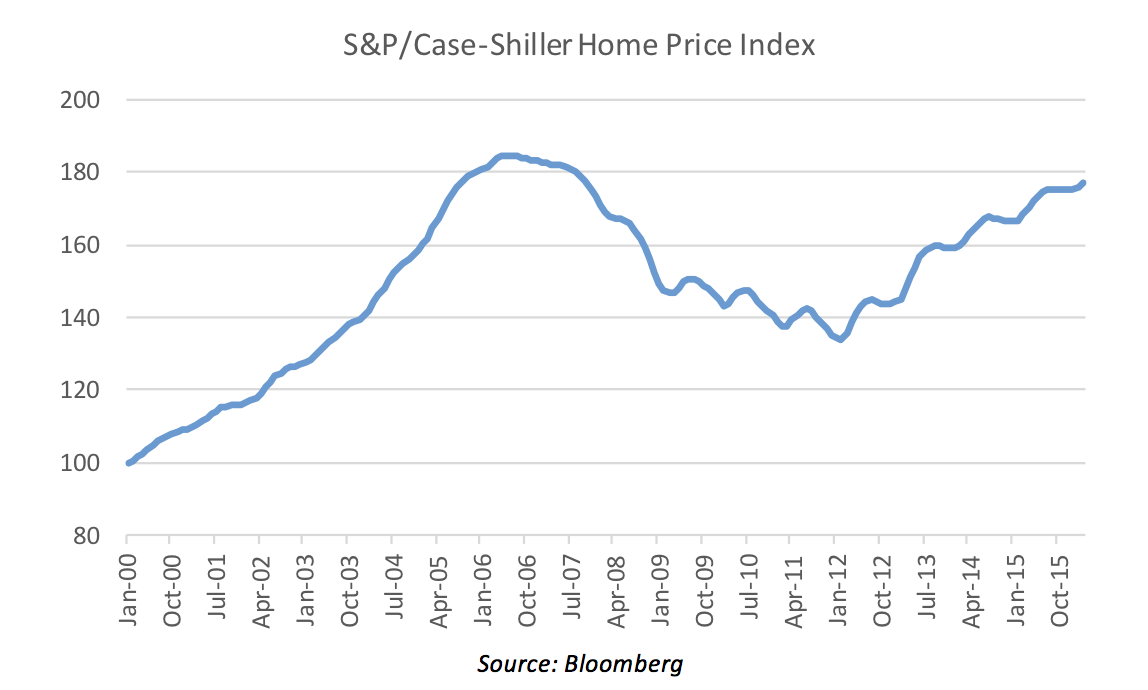
Furthermore, house prices have largely recovered after a 30 percent decline post GFC, as shown below. And yet, despite these prices, housing affordability in the US remains attractive driven by low interest rates and growing incomes.
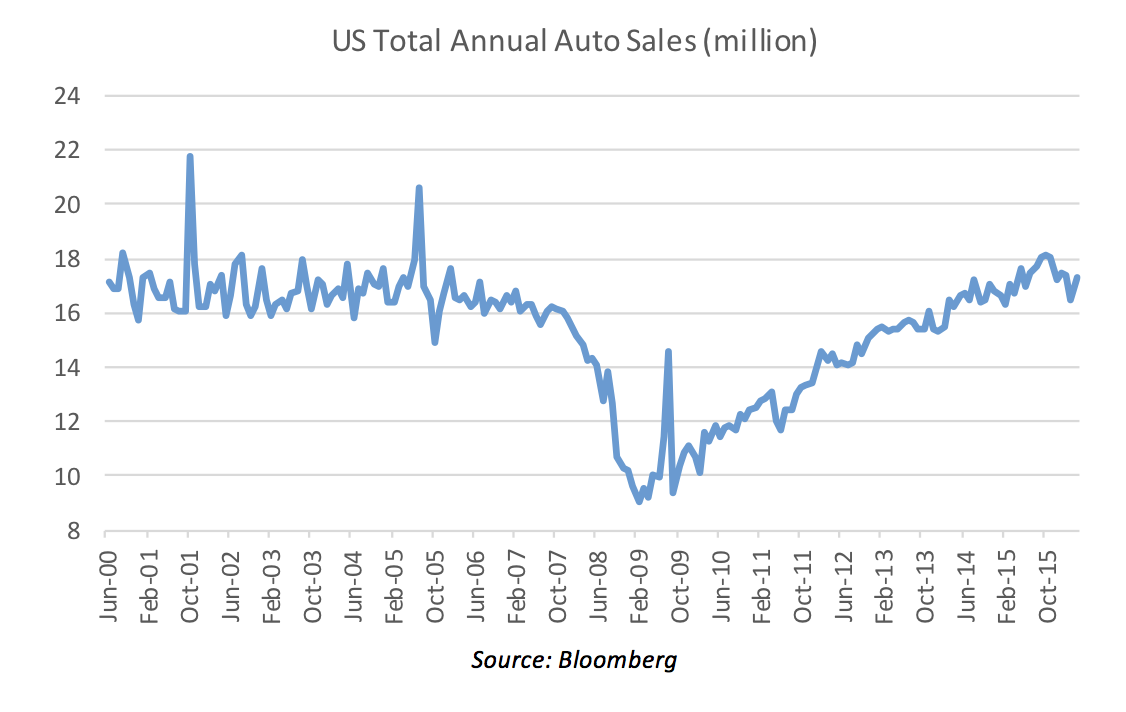
Finally, auto sales are back to their pre-crisis highs while drivers are benefiting from low gas (petrol) prices associated with the decline in the oil price and strength in the US dollar.
From the above we conclude that the health of the consumer has improved considerably since the GFC, and continues to do so. This is important since consumption drives more than two thirds of annual US gross domestic product.
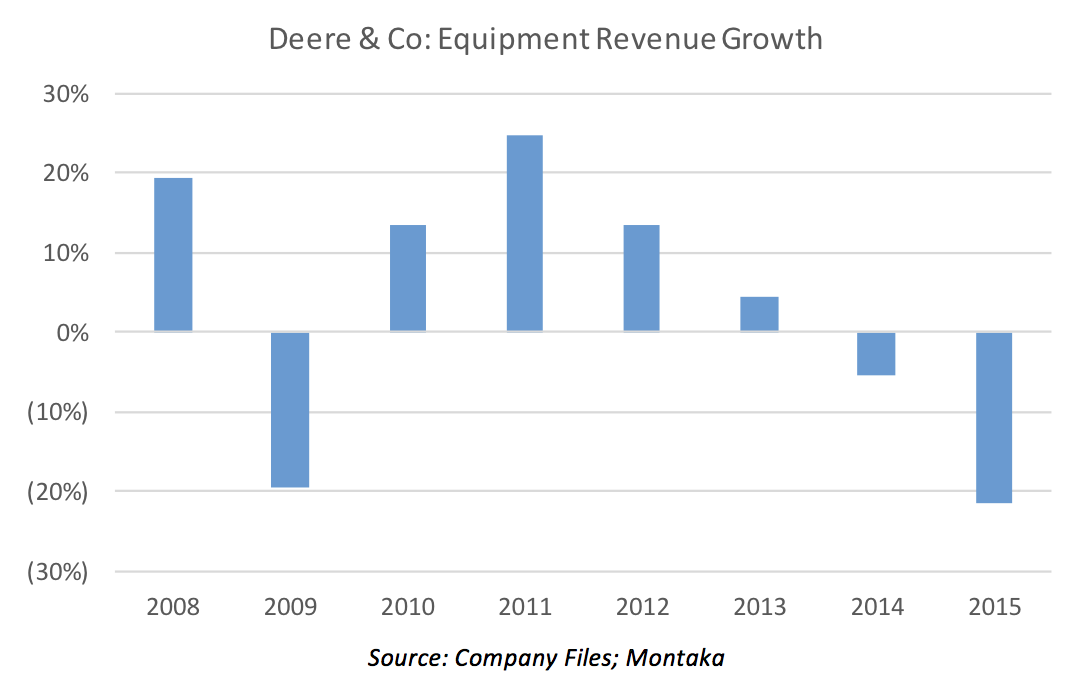
Moving on to the industrial side of the US economy we see a contrasting picture. Consider sales of agricultural equipment by market leader Deere & Company (NYSE: DE) – a company that derives three quarters of its earnings from North America. Sales growth in 2015 was more negative than what was observed in 2009!
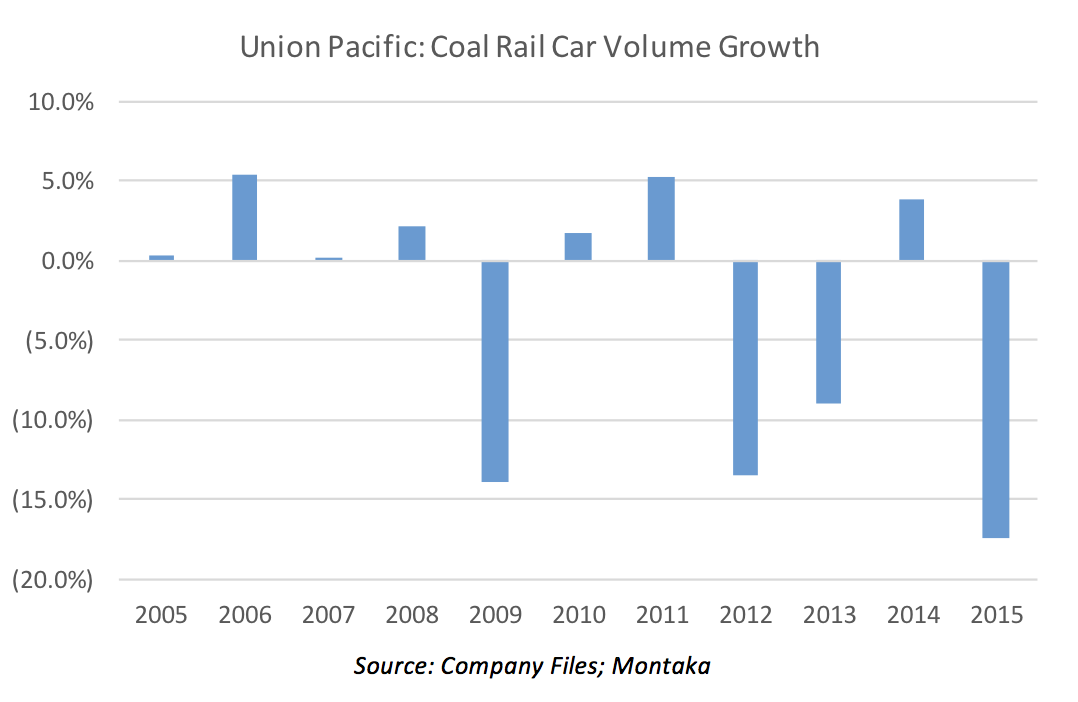
There is considerable weakness in the energy space. Take coal, for example. Shipments of US coal have been declining steadily since 2012, as illustrated below. Recently, activity and investment in the US oil space has all but ground to a halt as a result in the collapse in the oil price.
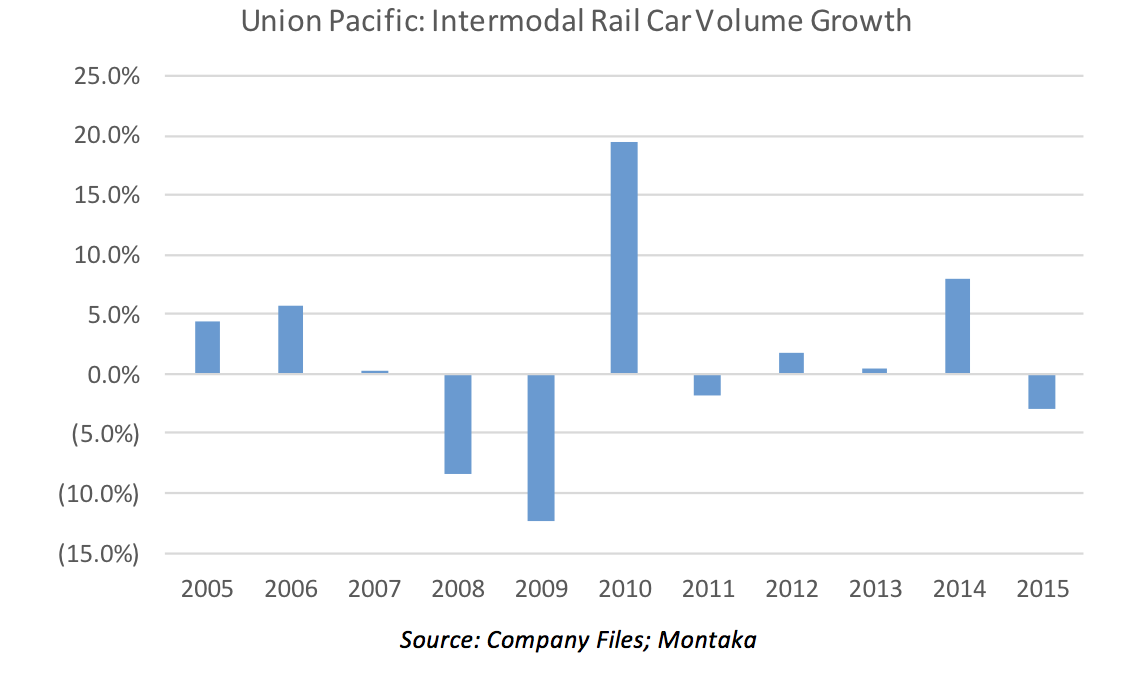
Even intermodal shipments have been weak of late. This is particularly curious given it is tied to the underlying retail sector of the US economy.
So how to circle-the-square with weak industrial sectors amongst an otherwise healthy consumer? Our take on the industrial weaknesses above is that they all relate primarily to a form of “oversupply” – as opposed to weakness in demand:
- Agriculture: an oversupply of soft commodity production has caused prices to fall which has impaired the financial positions of farmers. The situation is exacerbated in the US where the dollar is strong which undermines the competitive positioning of domestic producers.
- Energy: an oversupply in natural gas caused prices to fall and substitution of coal over recent years. Furthermore, the recent decline in the oil price was almost entirely driven by an acceleration in supply growth.
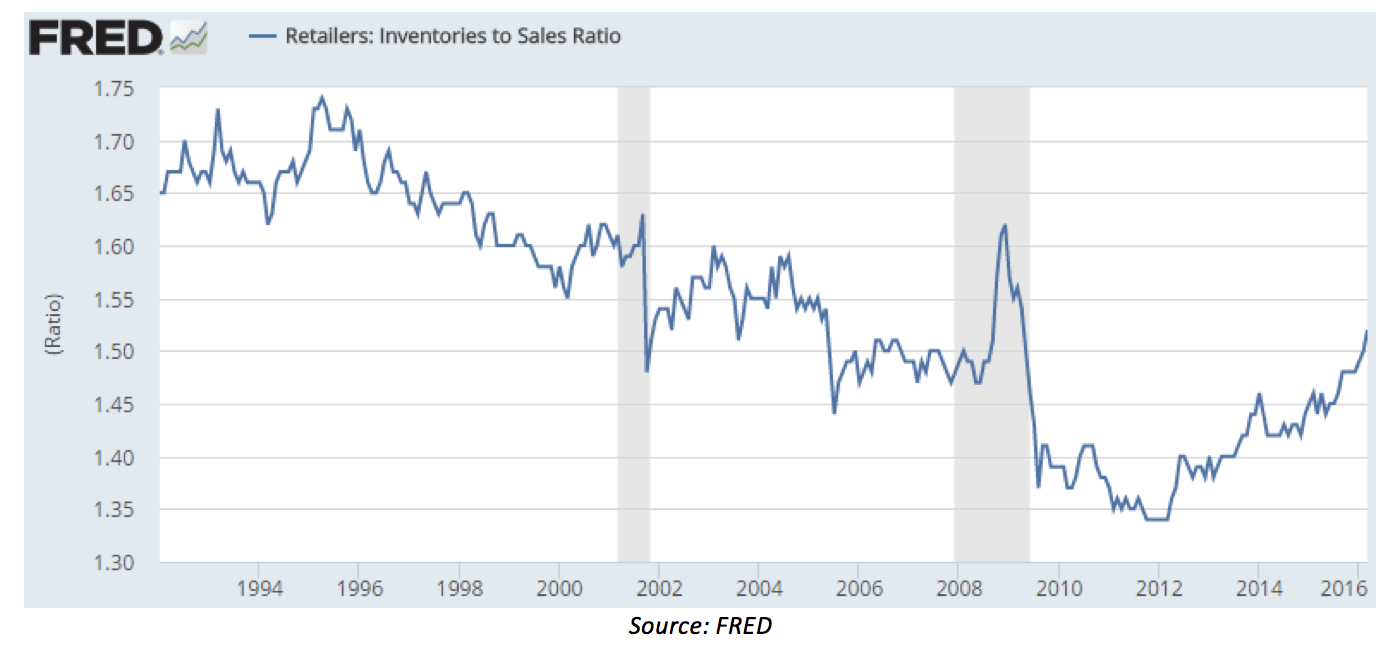
- Intermodal: we believe the weakness we are seeing is due to a build-up in aggregate inventories relative to sales, as shown below. Inventory builds are also a form of oversupply.
This is good news (or at least less bad news). Oversupplies will organically shrink as demand continues to grow; whereas demand-weakness is much more difficult to fix and tends to spread throughout the economy more broadly.
All in all, we think the US economy is improving. It is far too early to call it strong but the makings are there for strength to continue to build over time. And relative to other economies in the world, it is difficult to find a major economy that is currently on a better footing. It is for this reason that a large share of Montaka’s net exposure is tied to the US economy.
 Andrew Macken is a Portfolio Manager with Montgomery Global Investment Management. To learn more about Montaka, please call +612 7202 0100.
Making sense of the US economy
How is it that, in the world’s largest economy, unemployment is down, the housing market is strong, the Fed has started to raise rates – and yet, the agricultural sector is in a downturn more severe than during the Global Financial Crisis (GFC)? It’s somewhat of a contradiction to say the least.
The US economy is large and diverse. So generalizing its state as good, bad or otherwise is typically not particularly meaningful. At the very least, one needs to consider the key segments of the economy to arrive at any sensible conclusions.
Let’s start with the consumer. We know that wages are growing in the US; and we know that this growth is gently accelerating, as illustrated below.
Key measures of employment are improving. As illustrated below, the official civilian unemployment rate has recovered from the GFC and is back to historically normal levels.
We are seeing strength amongst small businesses – the provider of more than half the jobs in the US. On its most recent conference call, Insperity (NYSE: NSP) – a leading professional employer organization that co-employs around 160k small business employees across the US – highlighted a clear improvement in the space. Here is what the CEO had to say:
Next we move onto the housing market – arguably the most important asset class for the consumer. And here we are also seeing strength. New home sales are at their highest since 2008, as shown below.
Furthermore, house prices have largely recovered after a 30 percent decline post GFC, as shown below. And yet, despite these prices, housing affordability in the US remains attractive driven by low interest rates and growing incomes.
Finally, auto sales are back to their pre-crisis highs while drivers are benefiting from low gas (petrol) prices associated with the decline in the oil price and strength in the US dollar.
From the above we conclude that the health of the consumer has improved considerably since the GFC, and continues to do so. This is important since consumption drives more than two thirds of annual US gross domestic product.
Moving on to the industrial side of the US economy we see a contrasting picture. Consider sales of agricultural equipment by market leader Deere & Company (NYSE: DE) – a company that derives three quarters of its earnings from North America. Sales growth in 2015 was more negative than what was observed in 2009!
There is considerable weakness in the energy space. Take coal, for example. Shipments of US coal have been declining steadily since 2012, as illustrated below. Recently, activity and investment in the US oil space has all but ground to a halt as a result in the collapse in the oil price.
Even intermodal shipments have been weak of late. This is particularly curious given it is tied to the underlying retail sector of the US economy.
So how to circle-the-square with weak industrial sectors amongst an otherwise healthy consumer? Our take on the industrial weaknesses above is that they all relate primarily to a form of “oversupply” – as opposed to weakness in demand:
This is good news (or at least less bad news). Oversupplies will organically shrink as demand continues to grow; whereas demand-weakness is much more difficult to fix and tends to spread throughout the economy more broadly.
All in all, we think the US economy is improving. It is far too early to call it strong but the makings are there for strength to continue to build over time. And relative to other economies in the world, it is difficult to find a major economy that is currently on a better footing. It is for this reason that a large share of Montaka’s net exposure is tied to the US economy.
This content was prepared by Montaka Global Pty Ltd (ACN 604 878 533, AFSL: 516 942). The information provided is general in nature and does not take into account your investment objectives, financial situation or particular needs. You should read the offer document and consider your own investment objectives, financial situation and particular needs before acting upon this information. All investments contain risk and may lose value. Consider seeking advice from a licensed financial advisor. Past performance is not a reliable indicator of future performance.
Making sense of the US economy
This content was prepared by Montaka Global Pty Ltd (ACN 604 878 533, AFSL: 516 942). The information provided is general in nature and does not take into account your investment objectives, financial situation or particular needs. You should read the offer document and consider your own investment objectives, financial situation and particular needs before acting upon this information. All investments contain risk and may lose value. Consider seeking advice from a licensed financial advisor. Past performance is not a reliable indicator of future performance.
Related Insight
Share
Get insights delivered to your inbox including articles, podcasts and videos from the global equities world.