|
Getting your Trinity Audio player ready...
|
By Andrew Macken
Higher valuation multiples, such as the PE ratio, suggest major equities markets such as the S&P 500 are overvalued. And many investors are now wondering if they should cut their equity exposure.
The price-to-earnings (PE) ratio of the S&P 500 is approximately 25x, which most investors would agree does not scream ‘cheap’. This PE ratio is high by historical standards – its average is around 18-19x.
A 25x price-to-earnings ratio gives an earnings-to-price ratio, or ‘earnings yield’ of 4%, which is hardly exciting.
You could invest the same amount of money in US Treasury bonds – taking no equity risk at all – and generate about the same yield. This perhaps suggests that equities are overpriced – that shareholders are not being adequately compensated for the risks they are bearing.
But looks can be deceiving.
The truth is that comparing the current headline market metrics with historical valuations, or bonds, is invalid because they are being unusually distorted to the upside.
If you adjust for these distortions, equity valuations in general appear quite reasonable.
Distortion 1 – The S&P 500 looks expensive … the S&P ‘497’ less so
Here’s a simple one to begin with. If we strip out just three companies from the S&P 500 – NVIDIA, Tesla and Broadcom – to create a hypothetical ‘S&P 497’, the market is much more attractively valued.
As you can see in the chart below, this simple adjustment shows that while the S&P 500’s PE ratio is 25x (or a 4% earnings yield) … the S&P 497’s PE ratio is just 19x (or a 5.1% earnings yield) – in line with the historical average.
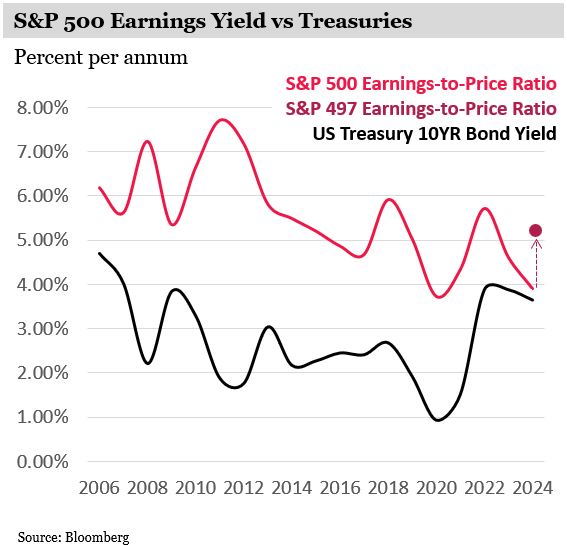
The impact of these three companies on the S&P 500 is outsized due to their high index weightings and very high PE ratios.
But this is just the beginning of the distortions that are making equities appear more expensive than they truly are today.
Distortion 2 – High R&D-led growth is depressing earnings yields
High R&D-led growth, particularly from large companies, is also distorting valuations and yields.
You should only really compare the yield of a bond to the earnings yield of a company if the company’s earnings growth is zero, or close to it. (The coupon paid to a bond owner is fixed – that is, it also has growth of zero.)
But the comparison really comes undone when the company in question – or indeed, an equity index that aggregates many companies – is growing rapidly.
Compared to a stream of constant earnings (like a bond), the value of a growing earnings stream is worth a lot more.
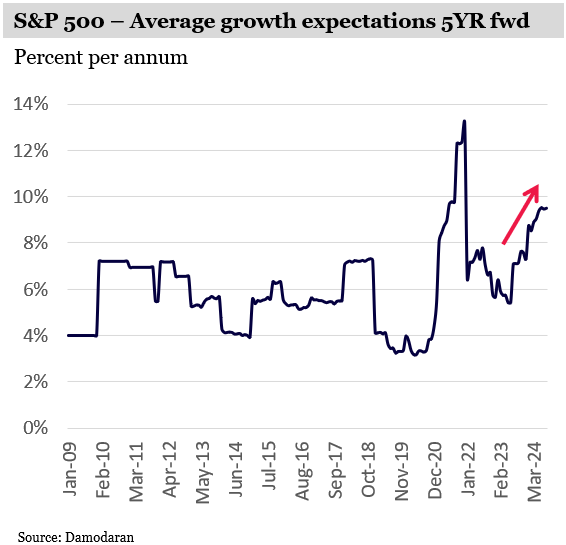
This carries particular importance today because the 5-year future growth expectations of the S&P 500 have accelerated to historic highs.
That’s because world’s largest companies – which carry the highest weightings in the index and therefore make the largest contributions to these metrics – have high expected future growth driven by technology such as cloud computing, weight loss drugs, or artificial intelligence.
Much of the growth investors see on the horizon over the coming years stems from large R&D expenditures over many years. And these continue today.
But despite often resulting in longer-term benefits, R&D is fully expensed in the year in which they occur. So, today’s earnings of big R&D spenders are arguably understated and their earnings yields are therefore also depressed.
These depressed earnings yields resulting from high R&D spend contribute to the investor misperceptions that equities today look expensive.
This effect is unusually magnified in the S&P 500 today because many of the world’s largest companies – and those with the biggest weightings within the index – also happen to be very large investors in R&D.
Looking through the distortions: equities appear attractive
What happens if we remove these distortions?
In the chart below, we have adjusted for the distortions described above. We show, in pink, the adjusted equity risk premium of the S&P 500. (The equity risk premium is the earnings yield less the 10-year Treasury bond yield).
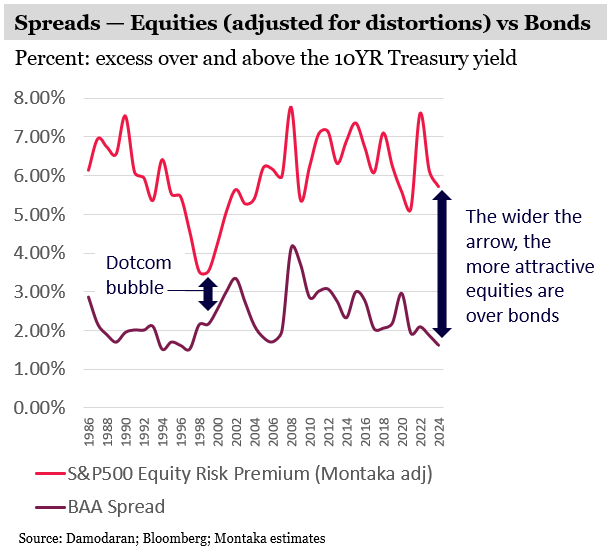
We compare this to the spread of BAA (low risk) corporate bonds, in purple. (Again, the spread is derived from the average BAA bond yield less the 10-year Treasury bond yield).
As you can see, the spread above Treasuries offered by equities today is much higher than corporate bonds (as it should be, given the higher risk borne by shareholders).
Importantly, however, the difference between these two spreads remains reasonably high by historical standards. (The wider the arrows between the two lines, the more attractive equities are over corporate bonds).
This stands in contrast to the ‘equities are expensive’ narrative that has gained steam of late.
Fears of heights likely misplaced
As the saying goes, looks can be deceiving. By looking under the hood of the headline metrics that many investors use to deduce overvaluation, or undervaluation, we can counter the big distortions that are making equities look expensive today.
The investment backdrop appears quite attractive today for global equities investors. Equities look reasonably priced in general. And this is against an economic backdrop of resilient growth in the US, decelerating inflation, and a recently commenced interest rate easing cycle.
This is a nice combination. And one that makes the ground fertile for great investment opportunity.
Andrew Macken is the Chief Investment Officer with Montaka Global Investments.
To learn more about Montaka, please call +612 7202 0100 or leave us a line at montaka.com/contact-us
Note: Montaka is invested in Blackstone.
Podcast: Join the Montaka Global Investments team on Spotify as they chat about the market dynamics that shape their investing decisions in Spotlight Series Podcast. Follow along as we share real-time examples and investing tips that govern our stock picks. Click below to listen. Alternatively, click on this link: https://podcasters.spotify.com/pod/show/montaka
To request a copy of our latest paper which explores the empirical research around the 3 pillars of active management outperformance, please share your details with us: