|
Getting your Trinity Audio player ready...
|
We hear and read a lot about reducing investment risk, which typically falls into one of two schools of thought: lower volatility of returns, or downside protection. These ideas of risk management are incomplete. A more comprehensive view of risk management in a portfolio should diminish the focus on price volatility as a measure of risk, and at the same time should include an understanding of upside capture along with downside protection. The power of a well-managed global equity long-short strategy shines under this lens as a structure under which an asymmetric return/risk profile can be generated.
Volatility has enjoyed a wonderful run as the preferred measure of risk when it comes to assessing securities and portfolios. Nobel Prize-winner Harry Markowitz used standard deviation of returns (otherwise volatility) as the representation of risk in his Modern Portfolio Theory in 1952, which became required teaching in tertiary economics and finance courses around the world. Markowitz went on to win the aforementioned prize in 1990 which likely served to reaffirm volatility’s standing among risk measures. Popularization increased in the financial community with the advent of indexes (primarily S&P’s VIX) that record equity market volatility, and the mind-boggling value of financial instruments that trade off the back of these.
A problem with defining risk as volatility is that the measure takes into account short-term price fluctuations that can occur for a range of reasons, and does not capture the inherent fundamental risk of loss. Of course historical price volatility can be measured, while underlying fundamental risk cannot, which means it is only natural that human minds are more accepting of the standard with its precise and quantifiable nature. Yet it should evoke the caution of Einstein (or lesser-known sociologist William Bruce Cameron):
“…not everything that can be counted counts”
A second problem is that volatility is a two-sided measure. It therefore records the “risk” of outperformance and underperformance equivalently. When did you last meet someone that was worried to the point of insomnia that his portfolio might gain in value?! On the other hand, downside risk, or the risk of loss, is a much better way to conceptualise risk as it focuses on the ex-ante possibility of loss. Practically this encourages an investment manager to worry about how his or her clients might lose money, rather than selecting stocks that won’t move about as much from day to day. Avoiding the big drawdowns is key.
Let us indulge in financial market time travel and a simple thought experiment. Assume an investor were to invest a sum of one million dollars in global equity markets at the beginning of 1997. He or she does this by investing in the MSCI World Index, reinvesting dividends along the way. The investment experience at the end of a two-decade horizon is a positive one indeed; the initial sum has turned into almost $4 million by the end of 2017. This is shown in the black bars on the left-hand-side chart below and the black line on the right-hand-side chart below. Now consider the same style of investment but with the ability to avoid down years.
In this hypothetical example, the same one million-dollar initial investment would actually grow to more than $11 million over the same 20-year period and outperform the previous scenario by more than $7 million. Similarly, this is shown in the red bars and red line in the below charts. And therein lies the power of downside protection for the equity market investor.
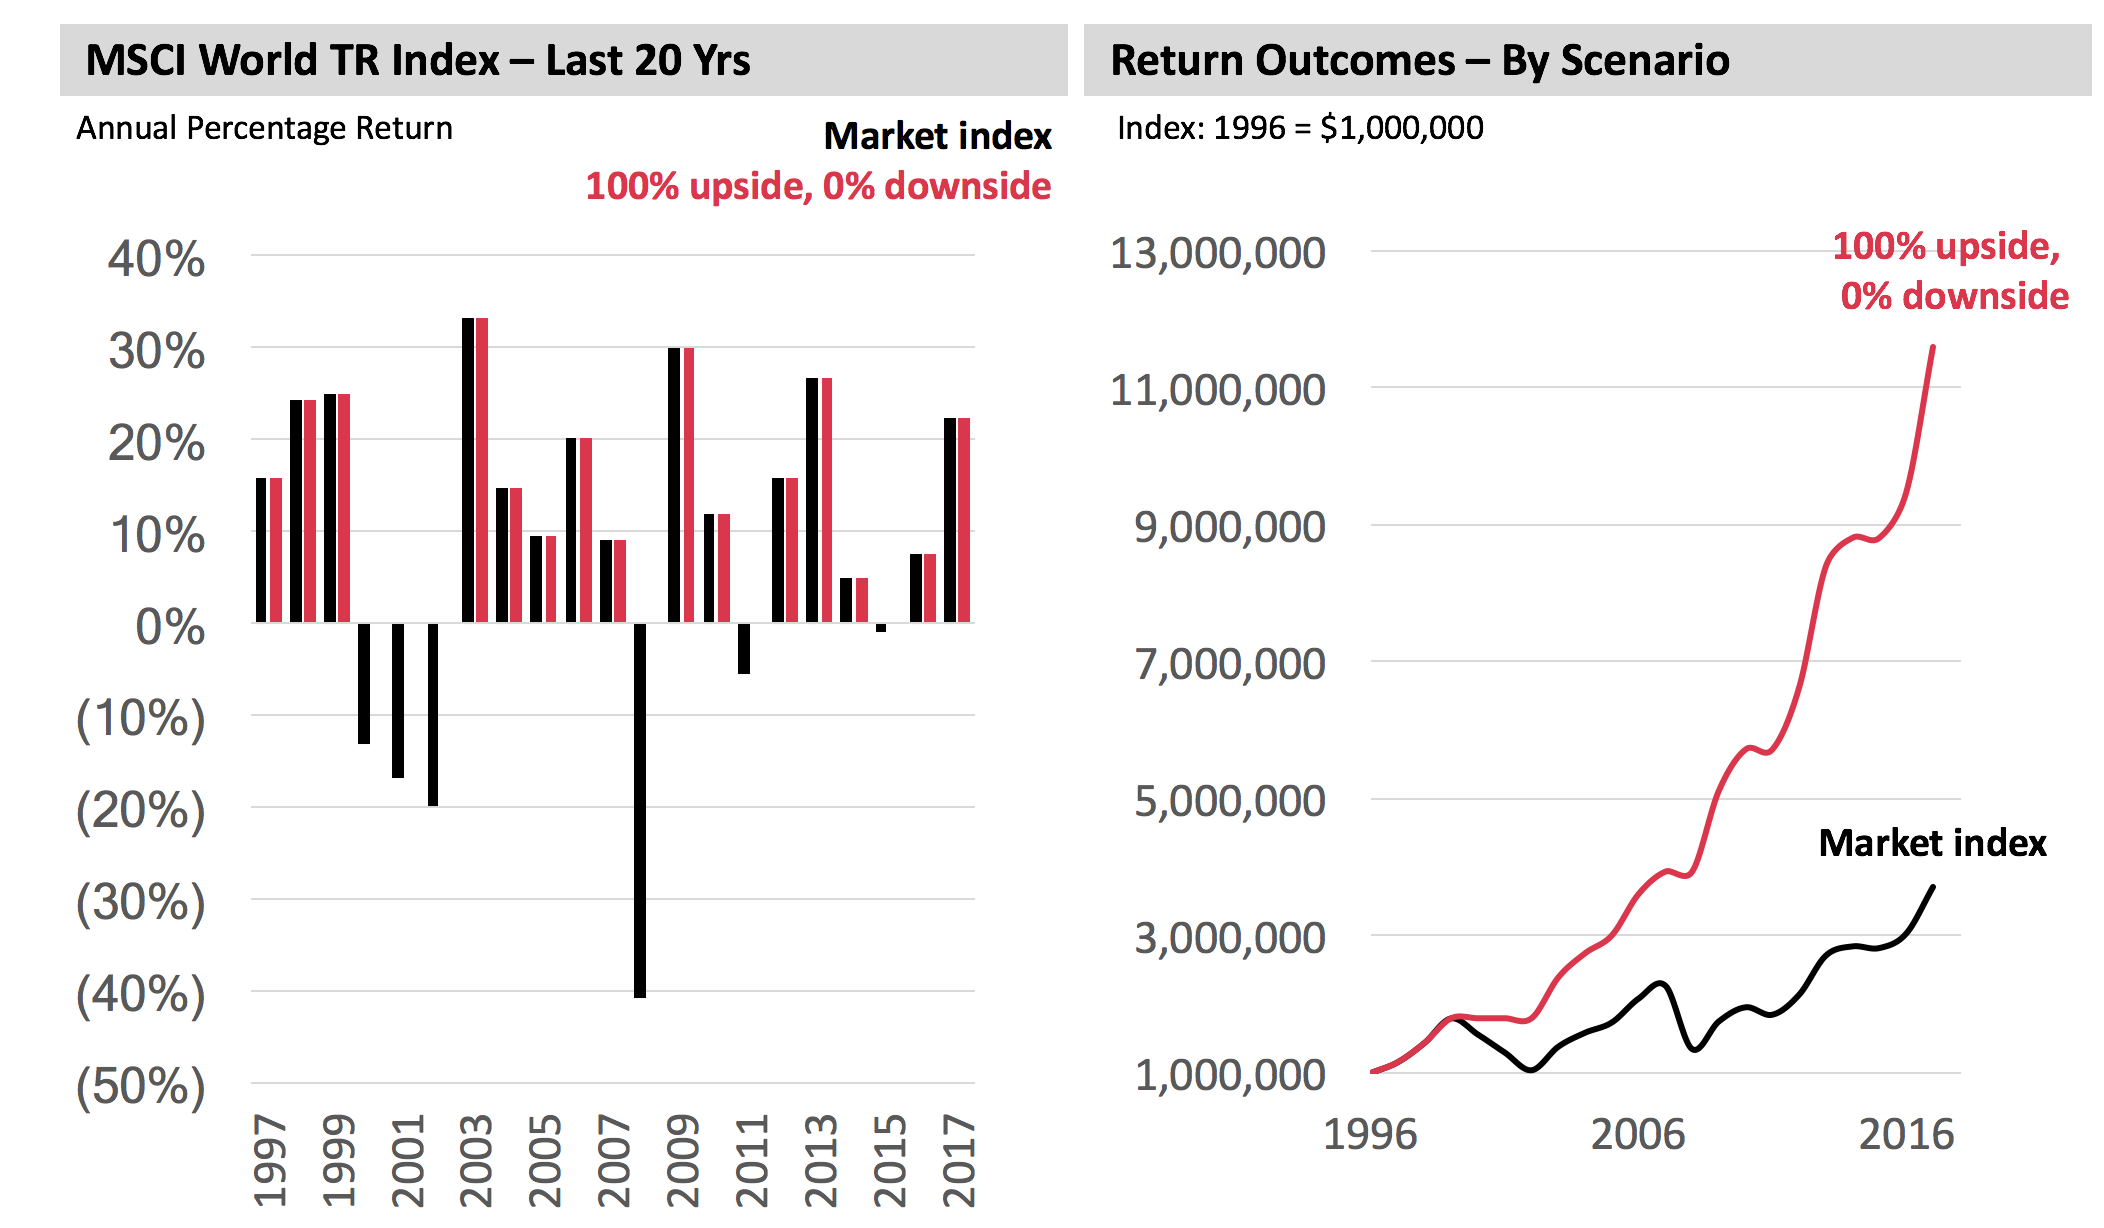
Source: MGIM, Bloomberg
Yet there is a subtle addition that investors should appreciate. The fantastic results above were not achieved by downside protection alone. How so? Importantly wealth compounded spectacularly both by protecting the downside and capturing the upside. Repeat for emphasis: BOTH!
It would be quite simple to reduce downside risk by simply running a lower-beta portfolio. Practically this could be achieved by investing in a combination of the index and cash, or by investing in a diversified collection of low beta stocks. In either case the full downside of the market falls would be cushioned by the lower risk portfolio positioning. But in doing so we would have fallen back into our old way of thinking of risk: two-sided volatility; and we would necessarily give up some of the upside performance as well as the downside. By corollary, the return achieved by this portfolio over the 2 decades from 1997 to 2007 would certainly be lower than that achieved by the market. Sure the bad years would not feel as bad but the good years wouldn’t be as good either. The result would be a less volatile pattern of returns rather than a better overall return outcome.
In order to achieve superior performance outcomes over the long term it is essential that we achieve an asymmetric return profile relative to the market: protecting (most of) the downside and capturing (most of) the upside. We believe that an actively managed global equities long/short strategy with variable net market exposure is well-structured to be able to achieve this. And this capability has been demonstrated by the Montaka strategy over the past (almost) 3 years since inception.
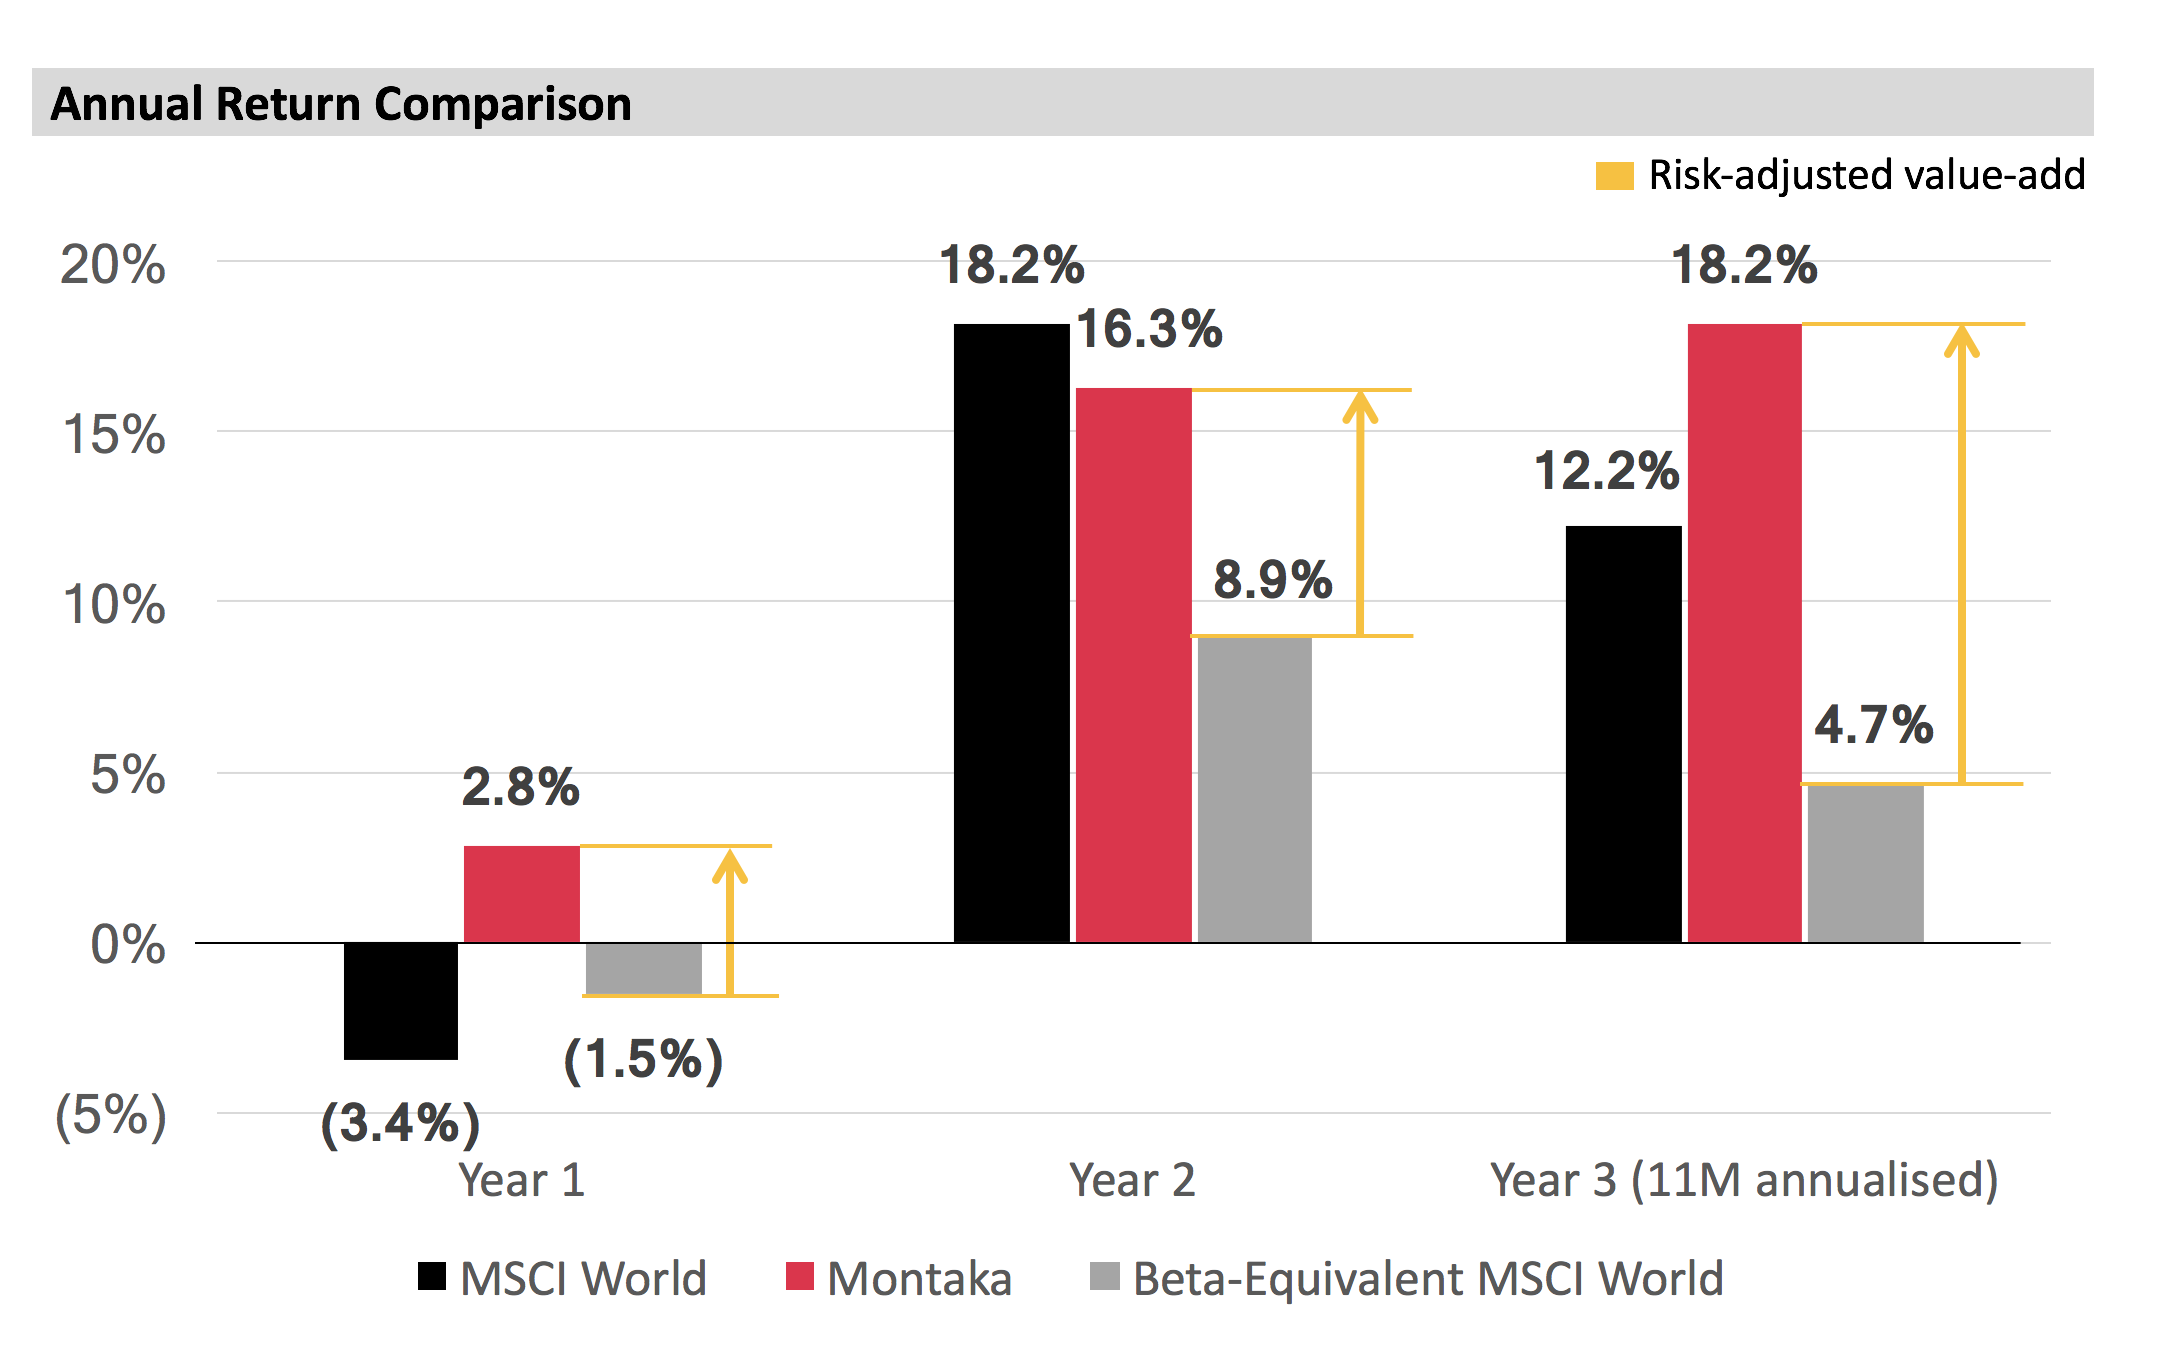
The following chart illustrates the point. The black bars represent the global equity market return in US dollars in each of the three one-year periods (11 months in the case of the third period) from 1 July 2015. A negative result followed by two strong results. The red bars represent Montaka’s performance in the same periods. Two key points of note.
Firstly, Montaka protected capital in the year that the market declined, and actually added value, by running a low net exposure and profiting from falling stock prices through the short portfolio.
Note: Return comparisons made on USD basis; all Montaka returns shown post fees.
Source: MGIM
Secondly, in the bull market years that followed Montaka kept pace with the market, and even handily outperformed in the last year (or 11 months). While the strategy operated with a lower net exposure to the market through these periods, outperformance in both long and short books enabled Montaka to capture the market’s upside.
For comparative purposes it is worth considering the performance of a hypothetical portfolio that is representative of a beta-adjusted index portfolio. That is, the portfolio generates returns of the index re-weighted to reduce the beta to a level similar to the ex-ante beta of the Montaka portfolio (around 0.4 for instance). The hypothetical returns of this portfolio are shown in the grey bars.
As one would expect, in year one the downside experienced is less than the market – but by no means could the hypothetical portfolio match the positive performance of Montaka. In years two and three the hypothetical portfolio fails to keep pace with the upward charge of the market. Unlike Montaka, this portfolio has no active management component to make up for its reduced market exposure. The fact that the beta-adjusted portfolio has achieved a pattern of returns that is less volatile than the market is little consolation when so much upside has been given away in the process.
The key to achieving superior investment performance over time is to understand that downside protection is the key to risk management if and only if this does not come at the expense of upside reduction. Montaka is an investment strategy that is structured to achieve this ambitious goal. So far Montaka is delivering on its objective for clients.
![]() Christopher Demasi is a Portfolio Manager with Montaka Global Investments.
Christopher Demasi is a Portfolio Manager with Montaka Global Investments.
To learn more about Montaka, please call +612 7202 0100.