Filtering through the endless stream of information and data that we are constantly bombarded with can be an overwhelming task, particularly in the financial markets. Separating signal from noise is made even more challenging as one person’s signal, may be another person’s noise and vice-versa. There is perhaps no better example in the market today of this signal vs noise paradox as the debate around what the U.S. treasury curve is telling us, before we dive in let’s go through a little bit of background.
The U.S. treasury curve is simply a graphical representation of interest rates that the U.S. government is able to borrow at for different maturities (tenors). For instance, from the chart below we can see that the U.S. government can borrow 30-year money at an interest rate of ~3%, with both the yellow and green lines terminating at approximately this point. Both the yellow and green lines create a downward sloping “curve” as you move backwards from 30 years, 10 years, 5 years, etc with their respective shapes quite different. The two lines both represent the U.S. treasury curve, except they are 1 year apart, the yellow line represents what the curve looked like a year ago while the green curve represents what it looks like right now. As we can see the curve is now much flatter (green) than it was last year (yellow), this is what is called “curve flattening”.
U.S. Treasury Curve (Now versus 1 Year Ago)
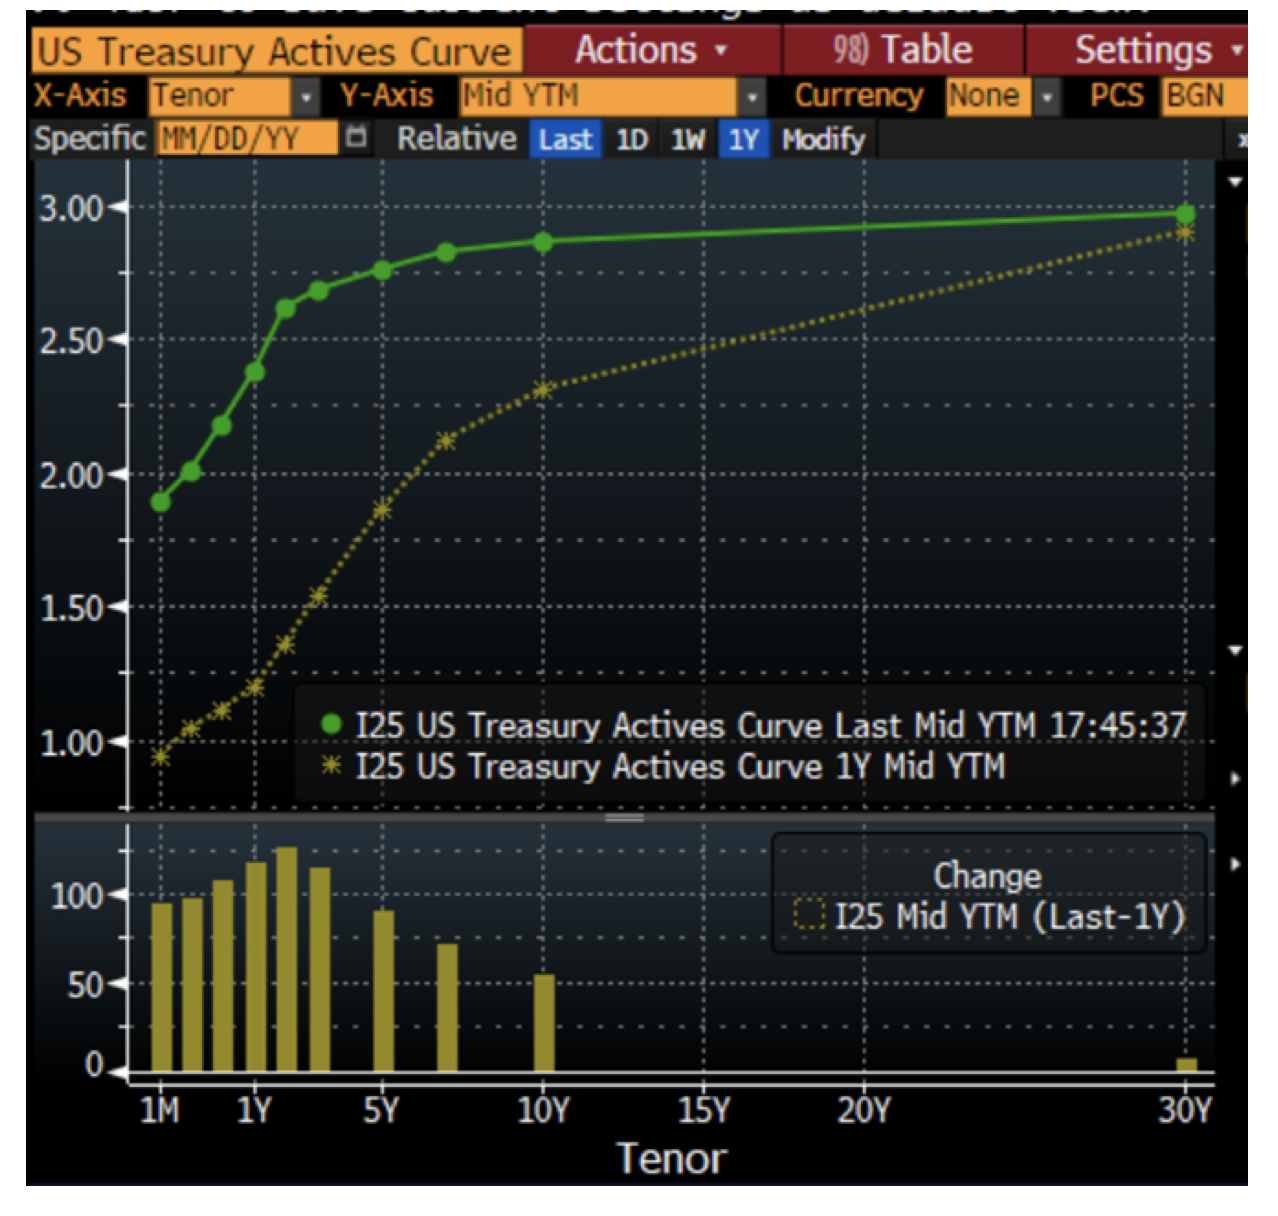
Source: Bloomberg
Historically the shape of the treasury curve, particularly the difference between the yield on 10-year debt and 2-year debt (10s2s Spread) has been a reliable leading indicator of U.S. recessions over the past 50 years, specifically when the spread turns negative (i.e the yield on 2-year debt is higher than 10-year debt). Given recessions usually accompany bull markets in bonds and bear markets in risk assets, namely equities, it is something we at Montaka Global are acutely aware of and constantly looking to position around in parallel with out deep, bottoms up, fundamental value investing framework.
The chart below highlights the last three major recessions in the U.S. (1990/1991, 2001, 2008/2009), in each of these instances before the recession hit (red shading) and a broad sell off in equities (S&P 500) occurred (white line), the 10s2s Spread inverted (i.e. fell below zero). Now, in the last three recessions, it took between 12-21 months after the curve inverted for a recession to break out and in all instances once it did, the stock market hit multi year lows 12-24 months later. Again, looking at the chart below, we can see that the curve (yellow line) is very close to inverting now, it is only 24bps away from an inversion and has been flattening since the start of 2014.
U.S. Recessions (Red Shading), S&P 500 (White Line) and the 10s2s Spread (Yellow Line)
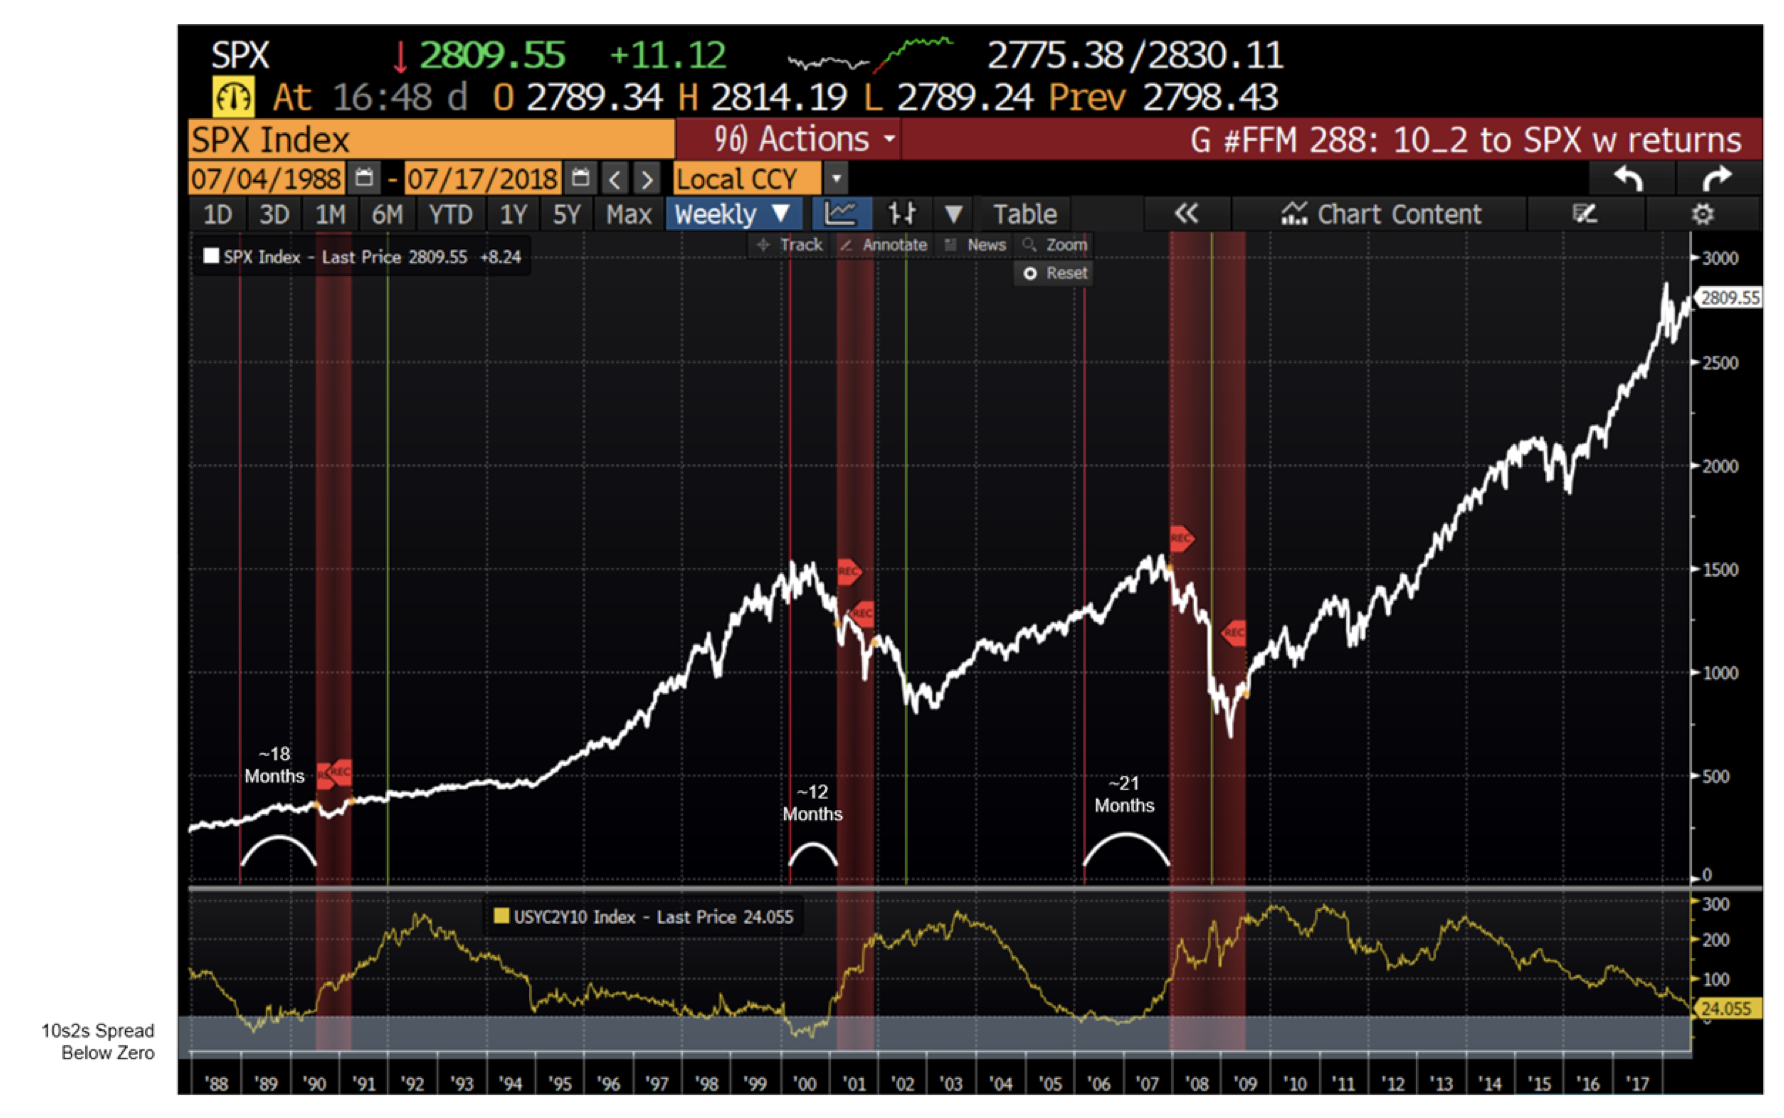
Source: Bloomberg
So here in lies the debate. The U.S. Federal Reserve is in the midst of a rate hiking cycle, having lifted short term rates 6 times over the last ~18 months (~150bps in rate hikes), significantly impacting the short end of the curve, however the long end has not moved higher at the same velocity, hence the curve has flattened and is now threatening to invert. To top matters off, the Fed is planning on raising rates twice more this year (based on the latest Fed “dot plot” projection), which would increase the short end by ~50bps, given the 10s2s spread is only 24bps currently, the risk is the Fed will invert the curve and send a recession into motion.
The reason we usually see a recession tied to a curve inversion is because liquidity into the economy stutters as banks are unable to borrow short and lend long economically (basically the core business of a bank). Additionally, a bank’s cost of capital sharply increases as it needs to pay customers more interest for holding their deposits. Hence when combined, can result in a sharply slowing economy and recession.
The current expansion (which by definition precedes a recession), is very old and has entered its 96th month compared to an average 58 months we have observed in the post-war period (since 1945). However, as the old adage goes, “expansions don’t die of old age”, which is true. They usually end from a combination of significant imbalances in the economy (difficult to identify as always) and excessive monetary tightening (may be heading in this direction).
So why is the Fed seemingly pushing the U.S. economy into a recession by raising rates? From their perspective, they aren’t. The prevailing view from the Fed seems to be that a flat or inverted yield curve may not signal a recession this time, as the economy largely depends on intermediate to long-term funding, so a short end curve inversion may not have the same meaning as it has in past cycles. In addition, the economy is positioned to continue growing strongly (low unemployment, tax cuts, higher government spending, etc) while inflation appears to be picking up and is likely to continue accelerating (tariffs, higher oil prices, etc).
Unfortunately, the Fed made similar arguments during the last cycle. At the time, it argued that the prevailing curve flatness and potential inversion could be ignored because a global savings glut was keeping long-term rates inorganically low in the U.S., so it continued hiking and inverted the curve. What followed was the global financial crisis, which of course was not created by an inverted curve, however it did lift the curtain on significant imbalances within the economy (subprime, CDOs, bank leverage, etc, etc) which once seen were impossible to “unsee”.
Interestingly the Chairman of the Fed, Jerome Powell, recently cast some doubt over whether the Fed would continue raising short term rates in his Semi-Annual Monetary Policy Report to the Senate, inserting “for now” into the official statement regarding short term interest rate trajectory and opening the door to reverse the policy if needed.
“With a strong job market, inflation close to our objective, and the risks to the outlook roughly balanced, the FOMC believes that–for now–the best way forward is to keep gradually raising the federal funds rate” – Jerome Powell Chairman of the U.S. Federal Reserve Bank July 17, 2018
Once the curve inverts and the economic dominos begin to cascade, it’s likely we’ll identify where the pressure points and the more extreme imbalances exist in the economy. Once this happens a recession and an equity market correction are likely to follow. This may be a game of chicken Mr Powell and the Fed are better off losing to the bond market…we will see.
 Amit Nath is a Senior Research Analyst with Montaka Global Investments. To learn more about Montaka, please call +612 7202 0100.

Playing Chicken: The Fed vs the Bond Market
Filtering through the endless stream of information and data that we are constantly bombarded with can be an overwhelming task, particularly in the financial markets. Separating signal from noise is made even more challenging as one person’s signal, may be another person’s noise and vice-versa. There is perhaps no better example in the market today of this signal vs noise paradox as the debate around what the U.S. treasury curve is telling us, before we dive in let’s go through a little bit of background.
The U.S. treasury curve is simply a graphical representation of interest rates that the U.S. government is able to borrow at for different maturities (tenors). For instance, from the chart below we can see that the U.S. government can borrow 30-year money at an interest rate of ~3%, with both the yellow and green lines terminating at approximately this point. Both the yellow and green lines create a downward sloping “curve” as you move backwards from 30 years, 10 years, 5 years, etc with their respective shapes quite different. The two lines both represent the U.S. treasury curve, except they are 1 year apart, the yellow line represents what the curve looked like a year ago while the green curve represents what it looks like right now. As we can see the curve is now much flatter (green) than it was last year (yellow), this is what is called “curve flattening”.
U.S. Treasury Curve (Now versus 1 Year Ago)
Source: Bloomberg
Historically the shape of the treasury curve, particularly the difference between the yield on 10-year debt and 2-year debt (10s2s Spread) has been a reliable leading indicator of U.S. recessions over the past 50 years, specifically when the spread turns negative (i.e the yield on 2-year debt is higher than 10-year debt). Given recessions usually accompany bull markets in bonds and bear markets in risk assets, namely equities, it is something we at Montaka Global are acutely aware of and constantly looking to position around in parallel with out deep, bottoms up, fundamental value investing framework.
The chart below highlights the last three major recessions in the U.S. (1990/1991, 2001, 2008/2009), in each of these instances before the recession hit (red shading) and a broad sell off in equities (S&P 500) occurred (white line), the 10s2s Spread inverted (i.e. fell below zero). Now, in the last three recessions, it took between 12-21 months after the curve inverted for a recession to break out and in all instances once it did, the stock market hit multi year lows 12-24 months later. Again, looking at the chart below, we can see that the curve (yellow line) is very close to inverting now, it is only 24bps away from an inversion and has been flattening since the start of 2014.
U.S. Recessions (Red Shading), S&P 500 (White Line) and the 10s2s Spread (Yellow Line)
Source: Bloomberg
So here in lies the debate. The U.S. Federal Reserve is in the midst of a rate hiking cycle, having lifted short term rates 6 times over the last ~18 months (~150bps in rate hikes), significantly impacting the short end of the curve, however the long end has not moved higher at the same velocity, hence the curve has flattened and is now threatening to invert. To top matters off, the Fed is planning on raising rates twice more this year (based on the latest Fed “dot plot” projection), which would increase the short end by ~50bps, given the 10s2s spread is only 24bps currently, the risk is the Fed will invert the curve and send a recession into motion.
The reason we usually see a recession tied to a curve inversion is because liquidity into the economy stutters as banks are unable to borrow short and lend long economically (basically the core business of a bank). Additionally, a bank’s cost of capital sharply increases as it needs to pay customers more interest for holding their deposits. Hence when combined, can result in a sharply slowing economy and recession.
The current expansion (which by definition precedes a recession), is very old and has entered its 96th month compared to an average 58 months we have observed in the post-war period (since 1945). However, as the old adage goes, “expansions don’t die of old age”, which is true. They usually end from a combination of significant imbalances in the economy (difficult to identify as always) and excessive monetary tightening (may be heading in this direction).
So why is the Fed seemingly pushing the U.S. economy into a recession by raising rates? From their perspective, they aren’t. The prevailing view from the Fed seems to be that a flat or inverted yield curve may not signal a recession this time, as the economy largely depends on intermediate to long-term funding, so a short end curve inversion may not have the same meaning as it has in past cycles. In addition, the economy is positioned to continue growing strongly (low unemployment, tax cuts, higher government spending, etc) while inflation appears to be picking up and is likely to continue accelerating (tariffs, higher oil prices, etc).
Unfortunately, the Fed made similar arguments during the last cycle. At the time, it argued that the prevailing curve flatness and potential inversion could be ignored because a global savings glut was keeping long-term rates inorganically low in the U.S., so it continued hiking and inverted the curve. What followed was the global financial crisis, which of course was not created by an inverted curve, however it did lift the curtain on significant imbalances within the economy (subprime, CDOs, bank leverage, etc, etc) which once seen were impossible to “unsee”.
Interestingly the Chairman of the Fed, Jerome Powell, recently cast some doubt over whether the Fed would continue raising short term rates in his Semi-Annual Monetary Policy Report to the Senate, inserting “for now” into the official statement regarding short term interest rate trajectory and opening the door to reverse the policy if needed.
“With a strong job market, inflation close to our objective, and the risks to the outlook roughly balanced, the FOMC believes that–for now–the best way forward is to keep gradually raising the federal funds rate” – Jerome Powell Chairman of the U.S. Federal Reserve Bank July 17, 2018
Once the curve inverts and the economic dominos begin to cascade, it’s likely we’ll identify where the pressure points and the more extreme imbalances exist in the economy. Once this happens a recession and an equity market correction are likely to follow. This may be a game of chicken Mr Powell and the Fed are better off losing to the bond market…we will see.
This content was prepared by Montaka Global Pty Ltd (ACN 604 878 533, AFSL: 516 942). The information provided is general in nature and does not take into account your investment objectives, financial situation or particular needs. You should read the offer document and consider your own investment objectives, financial situation and particular needs before acting upon this information. All investments contain risk and may lose value. Consider seeking advice from a licensed financial advisor. Past performance is not a reliable indicator of future performance.
Related Insight
Share
Get insights delivered to your inbox including articles, podcasts and videos from the global equities world.