“Beliefs are hypotheses to be tested, not treasures to be protected.” – Philip Tetlock and Dan Gardner
As investors, we are all engaged in the practice of forecasting. While this realization may be offensive to some value investors who swear against making macro predictions or forecasts, it is impossible to get away from estimating the probabilities of future events happening (unless one “invests” using only the rearview mirror). A simple five-line DCF valuation will require an investor to forecast future revenue growth, margins, fixed and working capital requirements, and an appropriate discount rate. Therefore, understanding the ins and outs of best practice forecasting will not only allow investors to generate more accurate forecasts, but to do so with regularity and greater confidence.
In his book “Superforecasting: The Art & Science of Prediction”, author Philip Tetlock follows a group of superforecasters participating in the Good Judgment Project (“GJP”), which itself was one of five teams involved in a five-year forecasting tournament sponsored by the U.S. intelligence community. The goal of Tetlock’s GJP was to determine whether some people are naturally better than others at forecasting, and whether forecasting performance could be enhanced. The superforecasters identified by Tetlock were, as a group, about 30 per cent more accurate than the average of the intelligence community itself, despite the huge information asymmetry between the two groups.
Part I of this two-part series will explore Tetlock’s findings about how the average forecaster can train their forecasting ability and perhaps join the ranks of the superforecasters. The good news is that neither superintelligence nor special expertise is required; in fact, Tetlock’s research over two decades up to 2004 tracked the predictions of several hundred experts (“smart” is an understatement here and half had PhDs), and found that they were roughly as accurate as a dart-throwing chimpanzee.
With that in mind, the following framework is what gives superforecasters their super title:
Ask good questions
The first step to finding useful answers is to ask good questions. In an investment context, it is too often tempting to ask broad, all-encompassing questions such as “will China have a hard landing?” or “can Netflix take over the world?” Such questions do not support a clear answer and the answers are often too vague to judge against the outcome.
Good questions, on the other hand, must be tied to clear outcomes and specific time frames. Instead of asking a broad, fundamental question such as “will China have a hard landing?” and expecting actionable answers, it is better to ask a handful of smaller yet still pertinent questions such as “will Chinese demand for steel fall below X by 31 December 2017?” and “will Chinese consumption reach X% of GDP by 30 June 2018?” (this is known as Bayesian question clustering). Setting a time frame is important, because open ended forecasts such as “QE will cause rampant inflation” or “the financial markets are long overdue a crash” are of limited value for both timely decision-making and self-improvement.
Quantify your forecasts
“There is no chance that the iPhone is going to get any significant market share.” – the 2007 quote that permanently cemented former Microsoft CEO Steve Ballmer at the top of Silicon Valley’s forecasting Hall of Shame.
While it is very tempting in hindsight to belittle Ballmer’s foresight, a superforecaster wouldn’t be so quick to judge his forecast as the worst tech prediction of this century. Firstly, as was just discussed, Ballmer’s forecast is without a time frame. But more importantly, his forecast is not quantified. What does “significant market share” mean? The iPhone has a high-teens market share of the global smartphone market, and a smaller share of the total global mobile phone market. Is that “significant”? It may not be significant absolute percentage-wise, but it is significant enough to make Apple the most valuable company in the world. Ask ten different people to assign a percentage to “significant” and you’ll get ten different answers.
Fuzzy forecasts such as “unlikely”, “fair chance”, “highly probable” and etc. were identified decades ago by the top echelons of the U.S. intelligence community as obstacles to critical decision making. Even an average forecaster can see the problem with the statement “a high probability of nuclear conflict”, when one intelligence analyst interprets that to be as high as 90% and another as low as 30%. Fuzzy, qualitative forecasts are used to protect the forecaster but do not result in useful forecasts – if the forecast outcome is positive, the forecaster is right (but how confident were they?); if the outcome is negative, the forecaster can retrospectively “dial down” the implied percentage assigned to the positive outcome.
Therefore, in order to i) produce forecasts that are useful and ii) continue improving one’s forecasting skill, forecasts need to be quantified with as much precision as the outcome warrants. By quantifying a forecast, the forecaster assigns a prior probability to an event, and can now explicitly update the forecast for new evidence using mathematical (or mental) models such as Bayes’ Theorem. If a forecasted outcome was simply “likely”, how does the forecaster adjust that forecast for new evidence? Does the outcome become “more likely” or “less likely”, and what do those categorizations actually mean?
Andrew recently wrote an article on using Bayes’ Theorem to update one’s beliefs / hypotheses, so I won’t delve into the details here (the article should be compulsory reading for all investors). However, it is worth reiterating that the most important consideration when using Bayes’ Theorem is picking the right base rate. Tetlock calls this the “outside view”, or how common something is within a broader class. Once the outside view has been established, we can use the “inside view”, or evidence specific to the particular case, to update the base rate and arrive at a posterior probability of the event happening.
Turning back to the Netflix example, one question that investors might ask is “will Netflix meet or beat its subscriber guidance in Q3 2016?” (precise question, fixed time frame). Using Bayes’ Theorem, we could take the following approach to forecast the outcome:
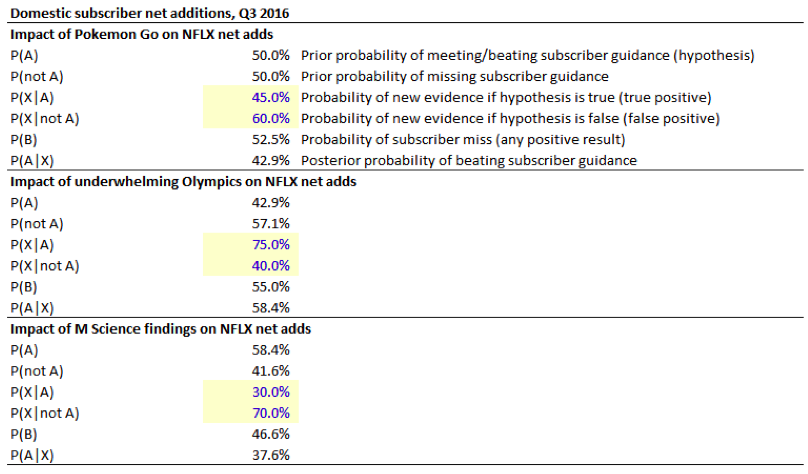
- In the U.S. market, Netflix has met or beaten its subscriber guidance in 4 of the last 8 quarters, so our base rate will be 50% (note that on a 4 quarter look-back, Netflix only beat guidance once for a 25% base rate, but we use 8 quarters here to mitigate the influence of once-off negative impacts in any given quarter)
- In July, Pokémon Go was released. This event might have been considered noise had Netflix’s Chief Content Officer not made an offhand comment to the effect that “we compete with Pokémon Go”. It is unlikely that Netflix management anticipated the release of Pokémon Go and factored its impact into the Q3 subscriber guidance, so we can assign a higher probability (but not much over 50/50) to the launch of Pokémon Go in a world where Netflix missed its subscriber guidance
- Then, there was the news of poor ratings for the Rio Olympics. Management had explicitly factored in the negative impact of the Olympics into Q3 subscriber guidance based on their experience during London 2012, which drew materially higher audiences than Rio 2016. Thus, we assign a higher probability to underwhelming Olympic ratings in a world where Netflix beat its subscriber guidance
- Finally, M Science reported this week that subscriber churn in the U.S. was likely to remain elevated due to the price increases, and sees zero net subscriber additions. M Science is a big data investment insights firm used by various hedge funds and trading desks, so the veracity of its data should be reliable. Therefore, we assign a high probability that M Science would make its findings in a world where Netflix again missed its subscriber guidance
After making these adjustments to the prior base rate of 50%, we now have a posterior probability of only 38% that Netflix will meet or beat its U.S. subscriber guidance. A similar exercise can be repeated for Netflix’s international subscriber guidance.
One thing to note is that broker upgrades, downgrades and price target changes were excluded as noise, because these do not constitute new factual evidence, but are rather opinions of research analysts whose interests are not always aligned with investors. Proprietary broker surveys are also given very little weight as they can be interpreted by brokers to support their recommendations.
Keep score
Last, but not least, is the importance of keeping score. It would be difficult for anyone to improve in any activity if they did not keep track of their progress, and the same applies to forecasting. Too often, forecasters make confident, high resolution forecasts but neglect to track the accuracy of their forecasts, or let hindsight bias influence the assessment of their accuracy.
The most commonly-used method of tracking the accuracy of probabilistic forecasts is the Brier Score, which is a sum of the square of the forecast error for both the event and the non-event. A Brier Score of zero means perfect accuracy (100% probability forecast for an event that happened), a Brier Score of 2 is the worst result (100% probability forecast for an event that didn’t happen), and a Brier Score of 0.5 is perfect randomness (our dart-throwing chimpanzee).
Returning to our Netflix example, if the company does miss its Q3 subscriber guidance, we would have a Brier Score of 0.28 [=(0.376-0)2+(0.624-1)2]. Tetlock’s superforecasters have Brier Scores of around 0.20 – 0.25, so the goal of keeping score is to track our forecasting progress and improve our accuracy towards zero.
This concludes Part I of our superforecasting series. Stay tuned for Part II, where we will explore the profile of a superforecaster.
CLICK HERE TO READ PART II.
Montaka is short the shares of Netflix.
 Daniel Wu is a Research Analyst with Montgomery Global Investment Management. To learn more about Montaka, please call +612 7202 0100.

Superforecasting Part I: becoming a better forecaster
“Beliefs are hypotheses to be tested, not treasures to be protected.” – Philip Tetlock and Dan Gardner
As investors, we are all engaged in the practice of forecasting. While this realization may be offensive to some value investors who swear against making macro predictions or forecasts, it is impossible to get away from estimating the probabilities of future events happening (unless one “invests” using only the rearview mirror). A simple five-line DCF valuation will require an investor to forecast future revenue growth, margins, fixed and working capital requirements, and an appropriate discount rate. Therefore, understanding the ins and outs of best practice forecasting will not only allow investors to generate more accurate forecasts, but to do so with regularity and greater confidence.
In his book “Superforecasting: The Art & Science of Prediction”, author Philip Tetlock follows a group of superforecasters participating in the Good Judgment Project (“GJP”), which itself was one of five teams involved in a five-year forecasting tournament sponsored by the U.S. intelligence community. The goal of Tetlock’s GJP was to determine whether some people are naturally better than others at forecasting, and whether forecasting performance could be enhanced. The superforecasters identified by Tetlock were, as a group, about 30 per cent more accurate than the average of the intelligence community itself, despite the huge information asymmetry between the two groups.
Part I of this two-part series will explore Tetlock’s findings about how the average forecaster can train their forecasting ability and perhaps join the ranks of the superforecasters. The good news is that neither superintelligence nor special expertise is required; in fact, Tetlock’s research over two decades up to 2004 tracked the predictions of several hundred experts (“smart” is an understatement here and half had PhDs), and found that they were roughly as accurate as a dart-throwing chimpanzee.
With that in mind, the following framework is what gives superforecasters their super title:
Ask good questions
The first step to finding useful answers is to ask good questions. In an investment context, it is too often tempting to ask broad, all-encompassing questions such as “will China have a hard landing?” or “can Netflix take over the world?” Such questions do not support a clear answer and the answers are often too vague to judge against the outcome.
Good questions, on the other hand, must be tied to clear outcomes and specific time frames. Instead of asking a broad, fundamental question such as “will China have a hard landing?” and expecting actionable answers, it is better to ask a handful of smaller yet still pertinent questions such as “will Chinese demand for steel fall below X by 31 December 2017?” and “will Chinese consumption reach X% of GDP by 30 June 2018?” (this is known as Bayesian question clustering). Setting a time frame is important, because open ended forecasts such as “QE will cause rampant inflation” or “the financial markets are long overdue a crash” are of limited value for both timely decision-making and self-improvement.
Quantify your forecasts
“There is no chance that the iPhone is going to get any significant market share.” – the 2007 quote that permanently cemented former Microsoft CEO Steve Ballmer at the top of Silicon Valley’s forecasting Hall of Shame.
While it is very tempting in hindsight to belittle Ballmer’s foresight, a superforecaster wouldn’t be so quick to judge his forecast as the worst tech prediction of this century. Firstly, as was just discussed, Ballmer’s forecast is without a time frame. But more importantly, his forecast is not quantified. What does “significant market share” mean? The iPhone has a high-teens market share of the global smartphone market, and a smaller share of the total global mobile phone market. Is that “significant”? It may not be significant absolute percentage-wise, but it is significant enough to make Apple the most valuable company in the world. Ask ten different people to assign a percentage to “significant” and you’ll get ten different answers.
Fuzzy forecasts such as “unlikely”, “fair chance”, “highly probable” and etc. were identified decades ago by the top echelons of the U.S. intelligence community as obstacles to critical decision making. Even an average forecaster can see the problem with the statement “a high probability of nuclear conflict”, when one intelligence analyst interprets that to be as high as 90% and another as low as 30%. Fuzzy, qualitative forecasts are used to protect the forecaster but do not result in useful forecasts – if the forecast outcome is positive, the forecaster is right (but how confident were they?); if the outcome is negative, the forecaster can retrospectively “dial down” the implied percentage assigned to the positive outcome.
Therefore, in order to i) produce forecasts that are useful and ii) continue improving one’s forecasting skill, forecasts need to be quantified with as much precision as the outcome warrants. By quantifying a forecast, the forecaster assigns a prior probability to an event, and can now explicitly update the forecast for new evidence using mathematical (or mental) models such as Bayes’ Theorem. If a forecasted outcome was simply “likely”, how does the forecaster adjust that forecast for new evidence? Does the outcome become “more likely” or “less likely”, and what do those categorizations actually mean?
Andrew recently wrote an article on using Bayes’ Theorem to update one’s beliefs / hypotheses, so I won’t delve into the details here (the article should be compulsory reading for all investors). However, it is worth reiterating that the most important consideration when using Bayes’ Theorem is picking the right base rate. Tetlock calls this the “outside view”, or how common something is within a broader class. Once the outside view has been established, we can use the “inside view”, or evidence specific to the particular case, to update the base rate and arrive at a posterior probability of the event happening.
Turning back to the Netflix example, one question that investors might ask is “will Netflix meet or beat its subscriber guidance in Q3 2016?” (precise question, fixed time frame). Using Bayes’ Theorem, we could take the following approach to forecast the outcome:
After making these adjustments to the prior base rate of 50%, we now have a posterior probability of only 38% that Netflix will meet or beat its U.S. subscriber guidance. A similar exercise can be repeated for Netflix’s international subscriber guidance.
One thing to note is that broker upgrades, downgrades and price target changes were excluded as noise, because these do not constitute new factual evidence, but are rather opinions of research analysts whose interests are not always aligned with investors. Proprietary broker surveys are also given very little weight as they can be interpreted by brokers to support their recommendations.
Keep score
Last, but not least, is the importance of keeping score. It would be difficult for anyone to improve in any activity if they did not keep track of their progress, and the same applies to forecasting. Too often, forecasters make confident, high resolution forecasts but neglect to track the accuracy of their forecasts, or let hindsight bias influence the assessment of their accuracy.
The most commonly-used method of tracking the accuracy of probabilistic forecasts is the Brier Score, which is a sum of the square of the forecast error for both the event and the non-event. A Brier Score of zero means perfect accuracy (100% probability forecast for an event that happened), a Brier Score of 2 is the worst result (100% probability forecast for an event that didn’t happen), and a Brier Score of 0.5 is perfect randomness (our dart-throwing chimpanzee).
Returning to our Netflix example, if the company does miss its Q3 subscriber guidance, we would have a Brier Score of 0.28 [=(0.376-0)2+(0.624-1)2]. Tetlock’s superforecasters have Brier Scores of around 0.20 – 0.25, so the goal of keeping score is to track our forecasting progress and improve our accuracy towards zero.
This concludes Part I of our superforecasting series. Stay tuned for Part II, where we will explore the profile of a superforecaster.
CLICK HERE TO READ PART II.
Montaka is short the shares of Netflix.
This content was prepared by Montaka Global Pty Ltd (ACN 604 878 533, AFSL: 516 942). The information provided is general in nature and does not take into account your investment objectives, financial situation or particular needs. You should read the offer document and consider your own investment objectives, financial situation and particular needs before acting upon this information. All investments contain risk and may lose value. Consider seeking advice from a licensed financial advisor. Past performance is not a reliable indicator of future performance.
Related Insight
Share
Get insights delivered to your inbox including articles, podcasts and videos from the global equities world.